
Four Roads From Here: What the Bond Market Is Pricing
Last Sunday's housing lock-in, viewed from the rates upstream.

If you've been watching the Treasury market lately, you've probably noticed something uncomfortable. The 30-year yield is sitting just under 5%. The 2- and 10-year are hovering near 4% and 4.4%. Mortgage rates have followed. And the calm Fed-cut narrative that dominated 2024 has quietly evaporated.
The CME FedWatch tool now puts the odds of a Fed rate hike in 2026 at roughly 23%. Push the window out to mid-2027, and the hike probability climbs to about 45%. That is a long way from "cuts are coming."
Last Sunday, Jarod published a piece on the housing lock-in — the dynamic where homeowners sitting on sub-4% mortgages refuse to sell, because moving means swapping a 3.5% mortgage for a 7%-plus one. The result is an inventory shortage that does not break until rates fall meaningfully.
That piece was about the symptom. This piece is about the cause.
Where do yields actually go from here? The plain answer: nobody knows. But "we don't know" is not a strategy. So here is the framework we are using.
What Happened
Three things have collided to push yields higher and keep them there.
The oil shock
The Iran war is now in its third month. WTI crude has traded above $100 for most of that period. The Strait of Hormuz is functionally compromised. March CPI came in at 3.3% — the highest since May 2024 — driven in large part by an 18.9% gasoline price surge. The OECD has warned headline U.S. inflation could reach 4.2% in 2026 if oil stays elevated.
The Fed dissent
At the April 29 FOMC meeting, the vote to hold was 8-4 — the first four-dissent vote since October 1992. Three Fed presidents opposed the dovish "additional adjustments" language because it implied the next move had to be a cut. One governor wanted to cut now. The committee is split four ways and has telegraphed nothing useful about what comes next.
The deficit problem
The IMF formally warned in April that surging Treasury supply is compressing the "safety premium" the U.S. has historically enjoyed in global bond markets. Federal debt sits near $39 trillion. Annual interest cost has crossed $1 trillion. Translation: even if growth slows, bonds may not rally the way they used to, because the buyer base is being asked to absorb more supply than it ever has.
Layer those three things together, and you get yields that are stickier and more volatile than the standard "the Fed will fix it" playbook anticipates.
What Does It Mean for Me?
For someone within ten years of retirement, this is not academic. It governs three things at the same time:
The price of any new mortgage or home-equity decision — Jarod's lock-in piece. The income side of any bond allocation in your portfolio. And the discount rate that prices your stocks, your real estate, and the present value of every future dollar you plan to spend.
So we built a framework. We mapped four scenarios for the next several months and assigned probabilities to each — not because we know which one happens, but because the spread between them is more important than picking the winner.
The four roads
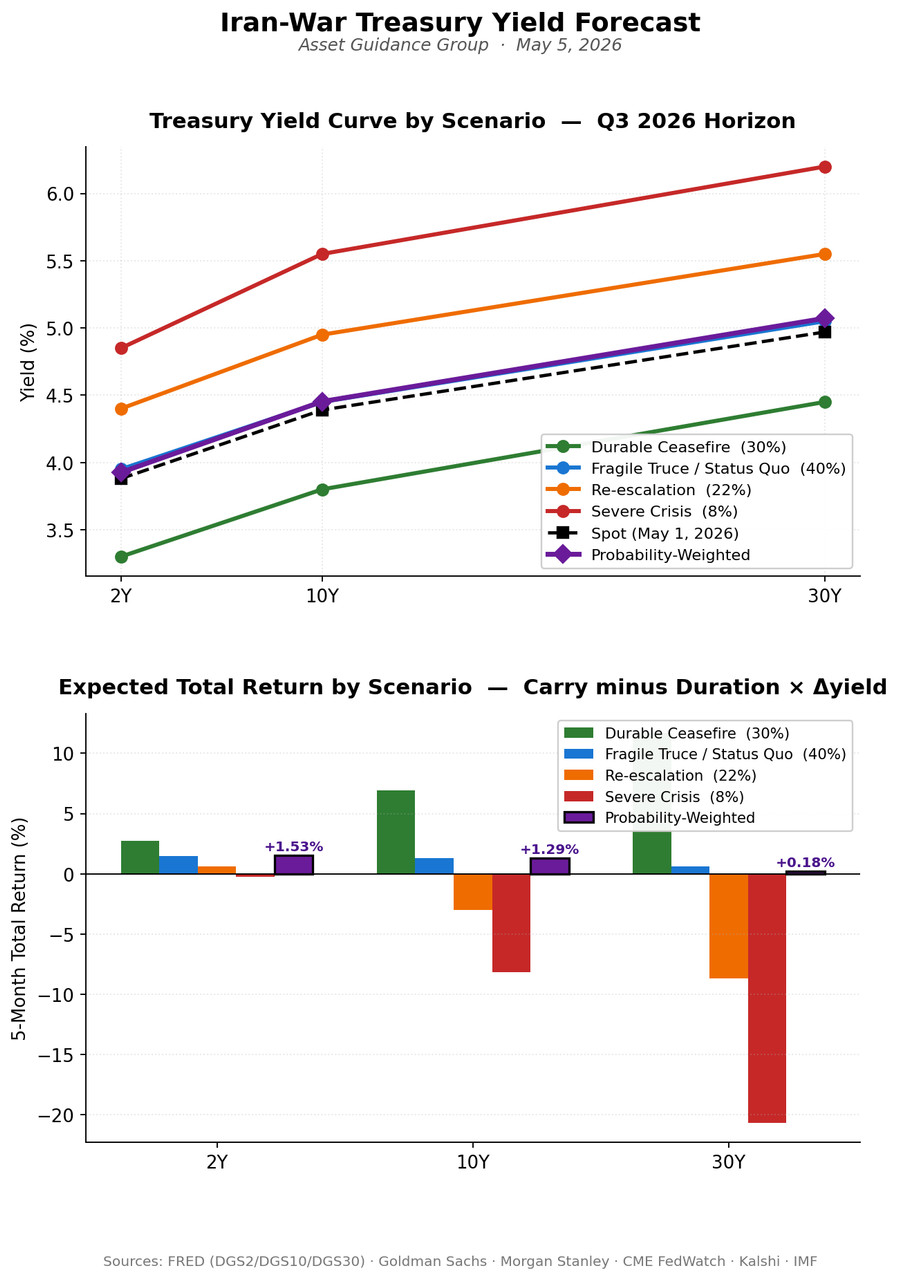
Durable Ceasefire (~30%). A genuine de-escalation in the Middle East. Oil falls back toward the mid-$70s. Headline inflation rolls over. The Fed gets cover to cut. Yields fall, especially at the long end. Probability anchored to current Kalshi pricing showing roughly 76% odds Hormuz traffic normalizes by January 1, 2027 — but most of that probability is concentrated in late 2026, not the next few months.
Fragile Truce / Status Quo (~40%). What we have today. Drone exchanges, sporadic Strait disruptions, oil hovering in the $90s, the Fed boxed in. Yields drift sideways. This is the modal case and roughly matches the published base cases at Goldman Sachs and Morgan Stanley.
Re-escalation (~22%). The conflict broadens. Oil pushes toward $125. Inflation reaccelerates. The Fed is forced to raise rates rather than cut them. Yields jump materially across the curve. Roughly Goldman's adverse case.
Severe Crisis (~8%). Strait of Hormuz fully closes. Oil spikes well above $140. The Fed faces an impossible choice between fighting inflation and protecting employment. Yields spike — particularly at the long end — and risk assets reprice violently.
The punchline most commentary misses
Probability-weighted, the bond market is barely above where it sits today. Add up the four scenarios, weight by their odds, and the expected case is "yields tread water" — single-digit basis points above current levels.
But the spread of outcomes is enormous, and it is not symmetric. The upside and downside are not evenly distributed across the curve.
The asymmetry is most extreme at the long end. A 30-year bond is dramatically more sensitive to yield changes than a 2-year. In the durable ceasefire scenario, a long bond rallies hard. In a severe crisis, it falls several times what a 2-year would. The 2-year, by contrast, has a much narrower range of outcomes — it earns something close to its current yield in three of the four scenarios.
This is why Jarod's piece and this one belong in the same conversation. The housing lock-in only breaks if the long end of the yield curve falls. If you believe that is likely, long-duration assets are the place to express it. If you believe yields stay elevated or move higher, the long end is where the pain is concentrated. Two ends of the same story.

What We're Doing About It
A few principles I can share without giving away the playbook.
First, our system does not bet on scenarios. It does not assume the ceasefire happens or that it does not. It does not assume the Fed cuts or hikes. It monitors the data — yields, oil, credit spreads, momentum, breadth — and adjusts positioning according to tested rules, every trading day, multiple times a day. Monitoring narrows exposure; it does not eliminate it — no system does — and we take every measure practicable to manage what we can manage and to acknowledge what we cannot.
Second, in environments where the spread of outcomes is wide and the probability-weighted base case is "tread water," our rules generally favor income at the front end of the curve over duration at the long end. The front end gives you yield with comparatively narrow surprise. The long end gives you the largest payoff if you are right and the largest hole if you are wrong. We do not take that bet on behalf of someone in the fragile decade without a structural reason to believe yields are headed lower. Conditions change. If the durable-ceasefire scenario gains real conviction — if oil rolls over, inflation breaks, the Fed signals — that calculus shifts, and a rules-based system can shift with it.
Third, the question is not which scenario happens. The question is whether your retirement portfolio survives any of them. The fragile decade — the five years before and after retirement — does not forgive a deep loss on long-duration bonds, even if the long-run thesis was eventually right. A 50% loss requires a 100% gain to recover. That math gets worse, not better, when you are drawing income.
That is the discipline. The world hands you four roads. You do not get to pick. You build a portfolio that can survive any of them.
Take Action
If you would like to talk about how the four-scenario framework applies to your portfolio — your bond allocation, your mortgage decisions, your retirement income plan — that is a conversation we have every week. Reply to this email, call the office, or schedule a review at assetguidancegroup.com/calendar. More on how we manage these dynamics is on the ATS landing page: assetguidancegroup.com/ats-mgmt-landing-page-347034. Email us directly at [email protected].
This post originally appeared on The Lighthouse on Substack — weekly financial analysis written specifically for people within ten years of retirement. Subscribe free at [The Lighthouse on Substack] or upgrade for weekly Trades of the Week picks.
Investing involves risk, including the possible loss of principal. This article is for informational purposes only and does not constitute personalized investment advice. Past performance is not indicative of future results. Forward-looking scenarios discussed in this article reflect Asset Guidance Group's analytical framework for evaluating a range of outcomes; they are not predictions, guarantees, or representations that any particular outcome will occur or that any specific positioning will produce any specific result. Yield, inflation, and policy expectations referenced are as of the publication date and may have changed materially by the time you read this.
Wallace R Nichols, MBA, JD, CFP Chief Investment Officer Asset Guidance Group, LLC, a registered investment advisor