The Asset Guidance Group Monday Outlook for the Week Ahead Starting June 21, 2022
U.S. markets were closed Monday in observance of the Juneteenth holiday. This week’s
economic calendar focuses on global growth, with June flash PMI readings from the
U.S, Eurozone, UK, Japan, and Australia. The reports will provide insights on how
ongoing supply issues and soaring prices are affecting the manufacturing and
services sectors. In the U.S., the stressed housing industry updates with existing
and new home sales on Tuesday and Friday, respectively. Fed Chair Powell begins
two-day Congressional testimony on Wednesday, and the stress test results for U.S.
banks are tentatively scheduled for Thursday. Also keep an eye on Fedex’s earnings
release after the close that same day, a key barometer of rising costs for U.S.
corporations. Internationally, UK CPI could approach 10% as households struggle
with sharply rising food and energy costs. Europe’s docket includes German PPI
along with the closely watched IFO business survey. In Asia, Japan’s headline inflation
may see a rare uptick given the country’s reliance on imported commodities. [1]
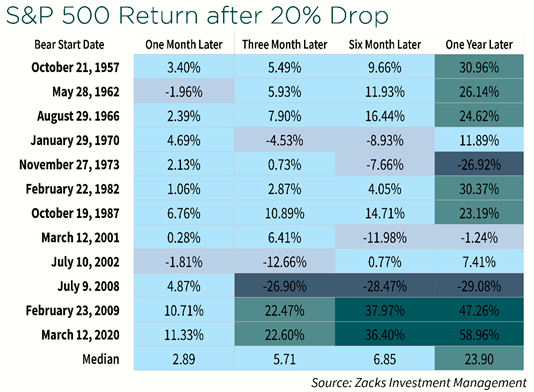
S&P 500 Returns After 20% Drops
The table above shows how the S&P 500 has historically responded in the months and years after closing in a bear market. While we cannot know whether or for how long the bear market will continue, we do know that periods of weak returns have almost always been followed by periods of strong returns. [2]
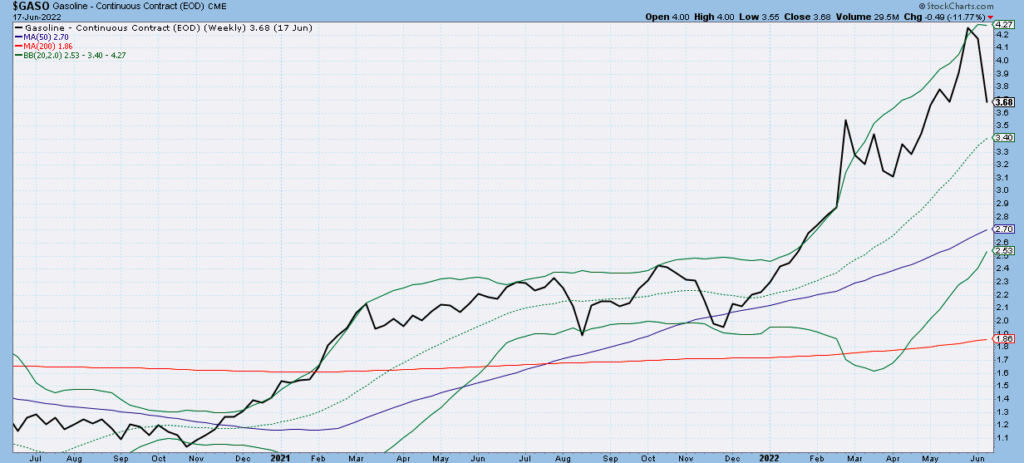
Chart of the Week: Gas Prices Finally Retreat
Gasoline Futures ($GASO Continuous Futures Contracts) have been uptrending since the pandemic lows but have accelerated their ascent this year. At the highs two weeks ago, the contract had more than doubled since January. However last week prices fell 9%, with half of that decline coming on Friday alone. Gasoline is still trading above its upsloping trendline and sits at the 50-day exponential moving average, both potential support levels. The MACD did make a lower low and the RSI is sitting right at 40, which is often support for a bullish trend. Although it hasn’t broken down yet, another week like last might bring some much needed relief to consumers. Click on the Chart to Enlarge. [3]
Sources: [1] tdainstitutional.com [2] Zacks Investment Management Services Mitch on the Markets [3] tdainstitutional.com; stockcharts.com.
Past performance is no guarantee of future results. Inherent in any investment is the potential for loss.

5 Questions to Ask About Medicare Downloadhttps://assetguidancegroup.com/5-questions-to-ask-about-medicare/


 Need 401k Plan Professional Advice? Click Here