The Asset Guidance Group Monday Outlook for the Week Ahead Starting August 15, 2022
U.S. Economic News:
The number of Americans filing for first-time unemployment benefits rose to its highest level since last November, another sign of the cooling labor market. The Labor Department reported initial jobless benefits rose by 14,000 to 262,000 last week. Economists had expected just an increase of 4,000 new claims. The four-week moving average of claims, smoothed to iron-out the weekly volatility, rose by 4,500 to 252,000. Claims have been slowly trending higher over the past few months, consistent with softening demand for workers. The Federal Reserve has been intent on cooling the labor market to help get the rate of inflation under control. Stuart Hoffman, senior economic advisor at PNC Financial Services Group wrote in a research note, “The rise in initial claims since early April is a cool breeze blowing at the hot labor market this summer.”
Confidence among the nation’s small business owners rose last month, reflecting improved expectations about business conditions. The National Federation of Independent Businesses (NFIB), a small-business lobbying group, reported its Small Business Optimism Index climbed 0.4 points to 89.9 in July. Economists were expecting the index to remain unchanged. Of the 10 index components, four increased while six decreased. Inflation remained a key concern, with 37% of small business owners reporting it as their single most important problem in operating their business. That reading was at its highest level since the end of 1979. On a positive note, the sub-index that measures the percentage of owners expecting better business conditions over the next six months recorded the biggest rise, up nine points from June’s record low.
Consumers got a reprieve from higher prices in July, according to the latest report from the government. The Labor Department’s Consumer Price Index (CPI) remained unchanged in July, down from a 1.3% increase the prior month and below economists’ expectations of a 0.2% advance. Over the past year, inflation retreated to 8.5% from its 41-year high of 9.1% in June. The closely-watched “core” measure of inflation that omits volatile food and energy rose 0.3% in July, down from a 0.7% gain in the prior month. The 12-month rate remained steady at 5.9%. The big rise in inflation was the cost of food, which rose 1.1% in July. Over the past year, food prices alone are up 10.9%, the highest since May 1979. Energy prices fell 4.6% in July, with gasoline prices down 7.7%. Sal Guatieri, senior economist at BMO Capital Markets wrote, “The July CPI report may be the first clear indication that consumers are pushing back against high inflation in response to tighter monetary policy.” In addition, he stated his view that inflation was close to peaking, though the “climb down the mountain will be slow.”
Prices at the wholesale level pulled back as well, implying more good news for consumer prices in the near future. The Labor Department reported its Producer Price Index fell -0.5% in July, its first negative monthly print since April of 2020. The reading was a surprise to the downside–economists had expected an increase of 0.2%. In annual terms, the headline PPI was up 9.8% in July, down from 11.3% in the prior month. The core producer price index, which excludes volatile food and energy prices, rose 0.2% in July, down from a 0.3% gain in the prior month. The decline appears to be largely result in the decline in energy prices. Energy prices dropped 9% in July, down sharply from their 9.4% gain in the prior month.
A survey of U.S. consumers showed sentiment rose in August, but remains near its all-time low seen in July. The University of Michigan’s index of Consumer Sentiment rose to 55.1 in its preliminary reading for this month—up 4 points from July. Economists had expected a reading of just 52.5. Consumer expectations for inflation over the next year ticked down to 5% from 5.2% last month, while expectations for inflation over the next five years ticked up to 3% from 2.9% in July, which was a six-month low. Americans remain concerned about the rapidly rising costs of key goods like food and rent, though declines in the price of gasoline in recent weeks helped lift the national mood. “All components of the expectations index improved this month, particularly among low and middle-income consumers for whom inflation is particularly salient,” wrote Joanne Hsu, director of the survey.
In a pair of speeches by Federal Reserve governors, Charles Evans, President of the Federal Reserve Bank of Chicago stated the July CPI data was “positive”, but “nobody can be happy” with an 8.5% annual inflation rate. Evans now sees the Fed’s benchmark policy rate rising to 3.25% – 3.5% by end of year, implying a slower pace of hikes ahead. On the economy, Evans said he didn’t think the economy would “turn down in a significant fashion anytime soon.” Minneapolis Fed President Neel Kashkari stated July’s CPI print was the “first hint” of possible good news on the inflation front. “I was certainly happier to see a surprise to the downside,” Kashkari said, but the Fed is “far, far away from declaring victory,” he added. [1]
Rent Hikes
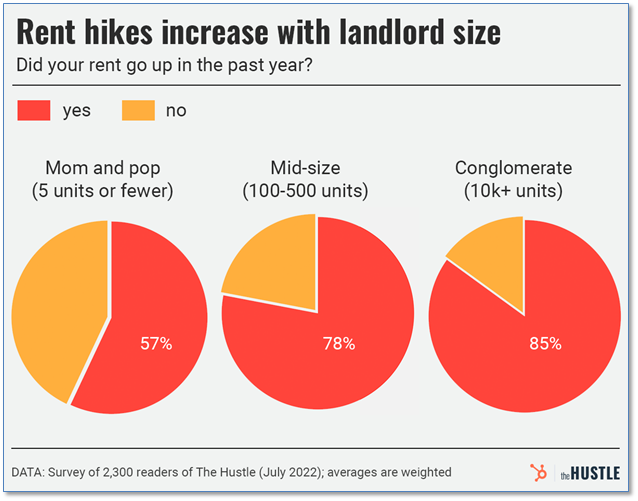
Over the past year nearly every essential good or service has escalated in price, but for those renting, costs have often skyrocketed. News site “The Hustle” conducted a survey attempting to gain more insight into how much rent has gone up over the past year and why. Their findings: a whopping 71% of renters experienced rent hikes last year with an average increase of 14.6%. In certain hot spots, such as Miami, San Diego, and Austin, average rent was up more than 25%! As for why, the survey found a very interesting relationship: the probability of a rent increase was highly correlated with the size of the landlord. Just 57% of Mom-and-Pop landlords (fewer than 5 rental units) raised rent over the past year. In contrast, over 85% of respondents reported rent hikes if their landlord was a conglomerate (greater than 10,000 units).
The Week Ahead
Traditionally, August’s final weeks are slow as traders squeeze in their final vacations
before the kids head back to school. Although the U.S. economic calendar is lighter
compared to recent activity, there will be two important releases mid-week.
Wednesday’s publication of the FOMC’s July meeting minutes will be scrutinized as
committee members have been publicly pushing back against the perceived
dovishness from Chair Powell’s press conference. The retail sales report for July is
expected to confirm that consumer spending is weakening as personal savings
dwindle and credit balances grow. Additionally, Walmart and Target will report
earnings after both companies warned last month of shrinking margins and rising
inventories. Other events of note include housing starts and existing home sales,
industrial production figures, and regional manufacturing updates. Overseas,
inflation and GDP data will be in focus. In the UK, CPI may touch 10% YoY, pressuring
the Bank of England to raise rates more aggressively. Retail sales on Friday will shed
further light on the situation for British consumers. In Europe, economic sentiment
and flash GDP readings highlight a sparse docket. Lastly, in Asia, Japan releases
preliminary Q2 GDP and July CPI, while China issues retail sales and industrial
production reports. [2]
Chart of the Week: RUT Struts
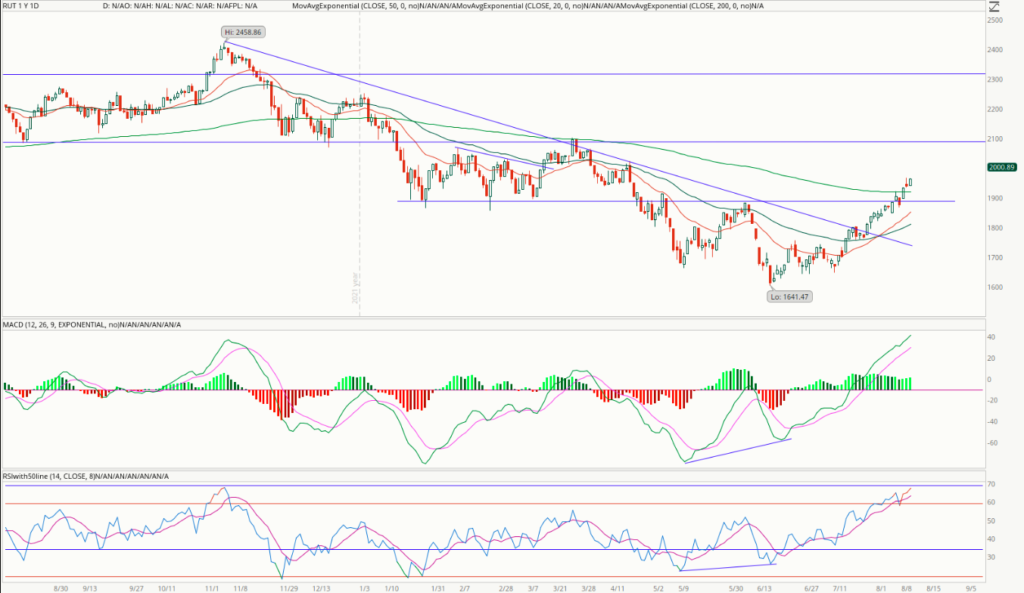
The Russell 2000 Index (RUT) has recently been outperforming its large cap
counterparts and checking the boxes for a trend reversal. It started at the June
16 lows, when both the MACD and RSI registered significant bullish divergences.
The next month was quiet as prices mostly
consolidated, albeit at higher lows than
June. Things started to pick up on July
19 as the small cap index broke to a new
short-term high. A bullish moving
average crossover and positive MACD
came shortly after, and last week price finally eclipsed the 200-day EMA and strong resistance at $1,920. With prices back above $2,000 for the first time since April, can it reach the next major resistance near $2,120?
Click on the Chart to Enlarge. [3]
Sources: [1] Asset Guidance Group analysis, www.stockcharts.com; All index- and returns-data from Yahoo Finance; news from Reuters, Barron’s, Wall St. Journal, Bloomberg.com, ft.com, guggenheimpartners.com, zerohedge.com, ritholtz.com, markit.com, financialpost.com, Eurostat,0020Statistics Canada, Yahoo! Finance, stocksandnews.com, marketwatch.com, wantchinatimes.com, BBC, 361capital.com, pensionpartners.com, cnbc.com, FactSet; [2] Data & chart from thehustle.com; [3] tdainstitutional.com; [4] stockcharts.com.
Past performance is no guarantee of future results. Inherent in any investment is the potential for loss.

5 Questions to Ask About Medicare Downloadhttps://assetguidancegroup.com/5-questions-to-ask-about-medicare/
 Need 401k Plan Professional Advice? Click Here