The Bond Market Broke Its Own Playbook
The Bond Market Broke Its Own Playbook
Treasuries broke their own rules — and retirement money should notice. (Part 1 of 2)
For most of the last forty years, the bond market followed a simple rule that nearly every retirement portfolio was built around. When stocks got scary, money flowed into Treasury bonds. Bond prices rose. Yields fell. The "safe" side of your portfolio worked exactly the way it was supposed to — it cushioned the blow when the "risky" side took one.
That rule just broke. Not in a single dramatic day, but over the eleven weeks between late February and last Friday, in a way that is genuinely unusual and that matters more for retirement portfolios than almost anything else happening in markets right now.
This is Part 1 of two. Today I'll walk through what happened and why it matters. Tomorrow: what's actually driving it, and what a retirement portfolio should be doing about it.
What Yields Just Did
A Quick Vocabulary
The words matter here, and most readers haven't been forced to think about them in a long time.
A Treasury yield is the interest rate you get when you lend money to the U.S. government by buying a Treasury bond. The "10-year yield" is the rate on a bond that matures in ten years; the "30-year yield" is the rate on one that matures in thirty. When yields rise, the prices of bonds you already own go down — because newly-issued bonds at the higher rate make your older, lower-rate bonds less valuable.
A basis point is one one-hundredth of a percent. A move from 4.00% to 4.50% is fifty basis points. The shorthand matters because bond people talk in basis points the way the rest of us talk in pennies.
The Trajectory
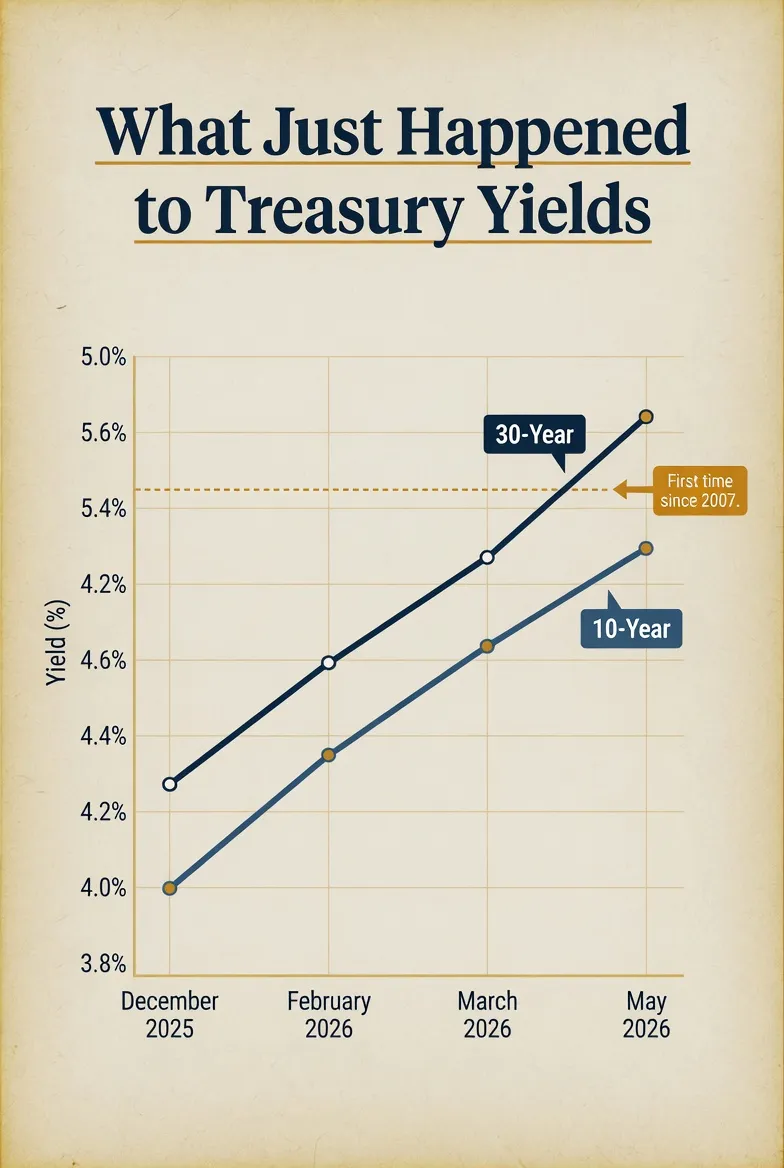
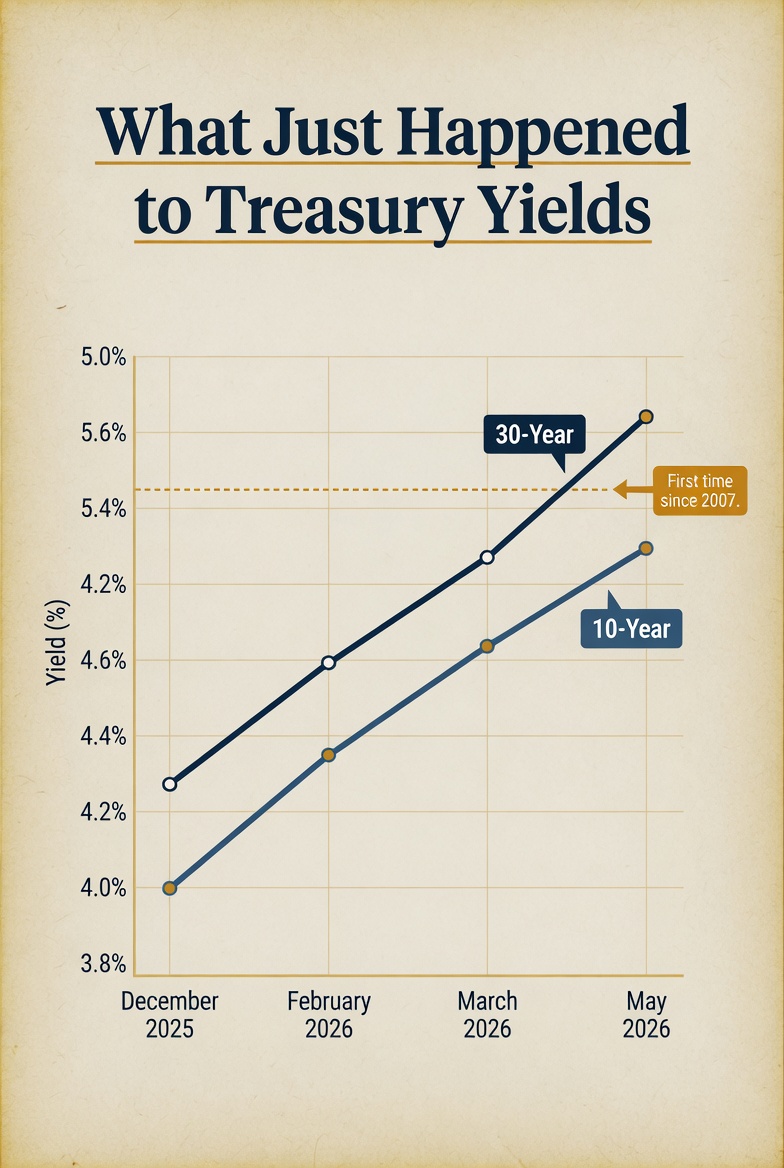
At the end of December 2025, the 10-year Treasury yield was about 4.14%. The bond market had just finished its best year since 2020. Most major firms — Schwab and the big banks — were projecting a calm 2026, with the 10-year drifting near 4% and the Fed cutting rates one or two more times.
That consensus held for about eight weeks.
On February 28, U.S. and Israeli forces struck Iran. Oil shocked higher. By March 9, the 10-year had pushed to 4.17%. By late March, the Treasury saw its weakest auction month in over three years — meaning investors didn't show up to buy government debt the way they normally do. On May 13, the 30-year Treasury yield cleared 5% — its first time since 2007. By Friday, May 15, the 10-year hit 4.60%.
In roughly eleven weeks, the 10-year rose about 70 basis points. The 30-year cleared a level it hasn't touched in nearly two decades.
That is not, by itself, an apocalyptic move. The 2022 bond crash was bigger in absolute terms. But the character of this one is different — and the character is what matters.
The Playbook Break
What Should Have Happened
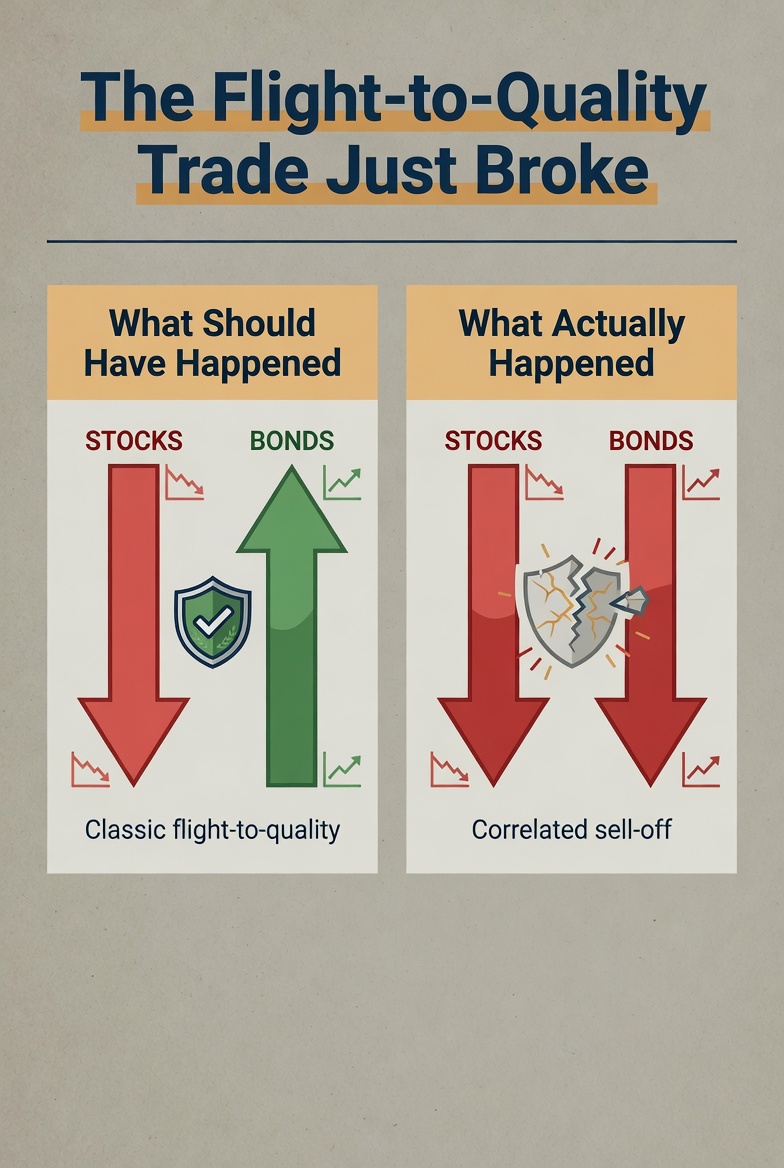
When wars break out, the textbook says investors run toward government bonds. They sell stocks, sell anything risky, and park money in Treasuries because Treasuries are supposed to be the safest thing in the world. That "flight to quality" — money flying into safe assets — usually pushes bond prices up and yields down at exactly the moment when stocks are falling.
That is not what happened.
What Actually Happened
When U.S. and Israeli forces struck Iran on the morning of February 28, Treasury yields rose. They didn't fall. CNBC's headline that day put it bluntly: oil surged, airlines sank, and bonds defied the safe-haven playbook.
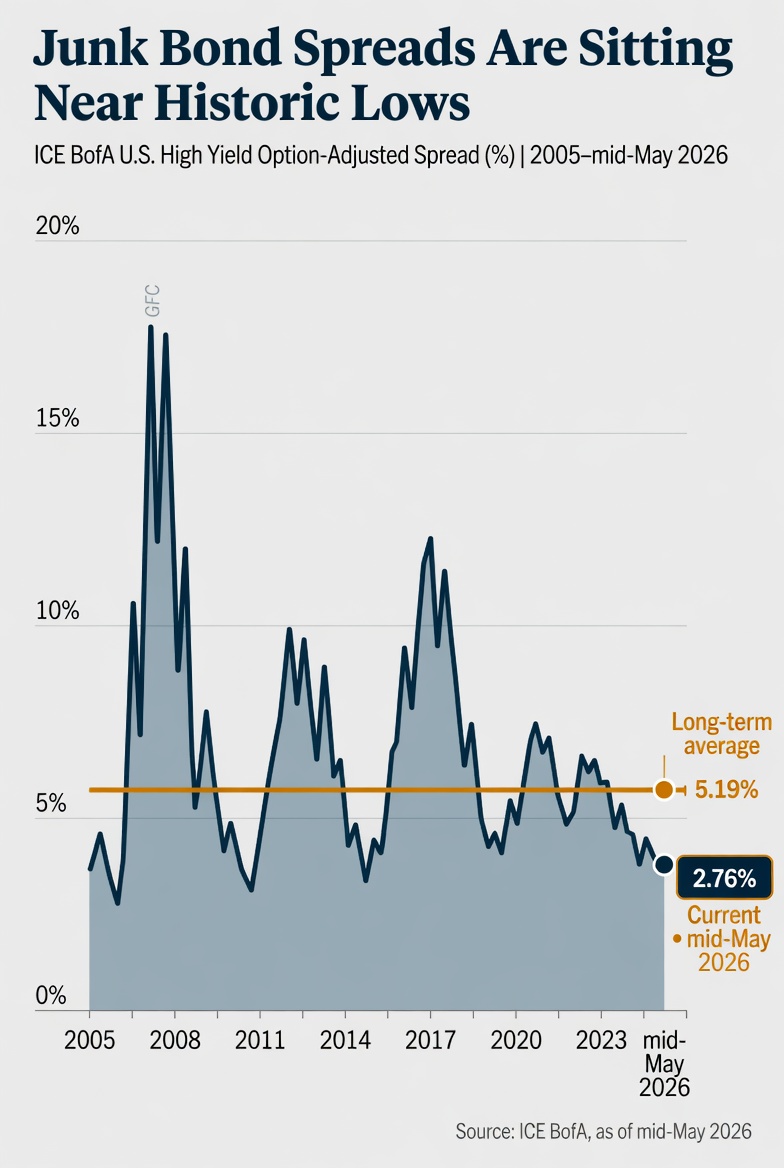
The break got more striking as the weeks went on. Long-duration Treasury bond funds lost value. Junk bonds — the riskiest part of the bond market, the part that's supposed to get crushed when wars start — held up. The gap between junk bond yields and Treasury yields, which usually widens dramatically during scary periods, barely moved at all. As of mid-May, that risk premium is sitting roughly one standard deviation below its long-term average. Junk bonds were calmer than long Treasuries. That is not a sentence I expected to write this year.
The implication is uncomfortable. The market is no longer treating long-dated Treasury bonds as the safe asset. As one credit analyst put it, the bond market is starting to look less like a safe-haven trade and more like a tug-of-war between carry, duration risk, and worry about U.S. fiscal health.
Why This Matters for Retirement Money
The Duration Trap
If you are in the fragile decade — the years right before and right after you stop working — there are probably more bonds in your portfolio than there were ten years ago. That's not an accident. The whole "as you get closer to retirement, shift from stocks to bonds" rule of thumb — the glide path that target-date funds and most retirement allocations are built on — rests on a single assumption: bonds reduce risk.
Duration is a measure of how sensitive a bond's price is to changes in interest rates. The longer the bond, the higher the duration, the bigger the price hit when yields rise. Many retirement portfolios — particularly those built through default 401(k) elections and target-date funds — carry duration far higher than most account holders realize. Long-duration Treasury bond funds, which many investors hold as their "safest" asset, have lost real money this year. Not paper losses that will heal when the Fed cuts. Real losses. And the rate-cut rescue everyone has been waiting for is, by the market's current pricing, not coming anytime soon — a topic we'll come back to tomorrow.
The Correlation Break
The premise that bonds zig when stocks zag was the original sales pitch for owning bonds in a retirement portfolio in the first place. It is the foundational logic behind the 60/40 portfolio — sixty percent stocks, forty percent bonds — which has been the default retirement allocation for two generations.
If bonds and stocks start falling together — and over the last several weeks they have, in multiple sessions — then the "diversification" most retirees believe they own may not be the diversification they actually own. A 62-year-old whose retirement plan assumes bonds will cushion the next equity drawdown has a planning problem if bonds stop doing that job.
These are not theoretical risks. They are visible in the data right now.
The Income Investor's Three Questions
For someone who holds bonds primarily for income — and for most people in the fragile decade, that is a meaningful share of the portfolio — the natural reaction to higher yields is to assume the news is good. Higher yields mean more income. More income means more retirement security. What's the problem?
The intuition is half right. It is also half dangerous. Whether higher yields help you or hurt you depends on three questions that don't get asked nearly often enough.
How Long Have You Owned What You Own?
If you bought a 10-year Treasury in 2021 at a yield of 1.5%, you locked in that yield. The bond pays its coupon regardless of where rates go. If you hold to maturity, you get exactly what you contracted for. Rising yields haven't changed your cash flow at all. The mark-to-market loss on paper is real but unrealized — it doesn't matter unless you sell.
But if you own bond funds or ETFs, the math works differently than holding an individual bond to maturity. A bond fund never matures. It is a perpetual rolling pool of bonds, and when yields rise, the price of the fund falls in real, realized terms. A 70 basis-point rise in yields on an instrument with 15 years of duration implies roughly a 10.5% price loss. That is not a paper loss. That is the NAV — net asset value, the per-share price of the fund — marked down, today.
For most retirement investors, this distinction is the single most consequential thing they don't realize about their own portfolio. Many people in target-date funds and default 401(k) bond sleeves are holding long-duration bond ETFs without knowing it — and have lost real money this year on what their statement still calls "the safe portion."
A point worth being direct about, because the rest of this piece is going to describe how AGG's fixed-income design responds to a regime like this one. AGG's fixed-income positioning is currently implemented through carefully selected ETFs, and our portfolios participated in last week's broader fixed-income drawdown along with the rest of the market. The differentiator is not the vehicle. The differentiator is the duration that vehicle is carrying when the regime shifts — and whether someone is actively managing it against current conditions or letting it run on a default setting written years ago. That is the framework the second half of this article walks through.
What Is Your Duration?
The breakeven math is brutal. The longer the duration of what you own, the less it takes for a yield rise to wipe out a year's coupon income. A 15-year duration bond fund yielding around 5% has a coupon that gets erased by roughly a third of a percentage point of yield increase. A 2-year duration short bond fund yielding around 4.5% can absorb a much larger yield rise before the coupon is gone. The shorter the duration, the wider the margin of error.
That is why short-duration positioning has been the relative winner across the eleven weeks we just walked through, and why money has been flowing into ultrashort bond categories at a record clip. Not because shorter bonds are exciting. Because shorter bonds let income investors actually collect the income without watching the principal evaporate underneath.
Can You Reinvest at the New Rates?
For an investor with maturing bonds or new cash to deploy, the May 2026 yield environment is the best entry point on the long end in nearly twenty years. A 30-year Treasury at 5% sits roughly 85 basis points above its long-term average. A five-year breakeven inflation rate around 2.53% implies a real yield of about 2.5% — meaningfully positive territory that did not exist for most of the period from 2011 through 2022.
But "for new money" is the operative phrase. If your bond allocation is fully invested at older, lower coupons inside long-duration funds, you cannot capture today's yields without first realizing the price loss on what you own. The reinvestment opportunity is real and it is meaningful — but it is only available to portfolios that have the capacity to capture it. Capital coming due. Cash on hand. Positions short enough in duration not to be hostage to the existing book.
The HY Spread Trap
There is a separate dynamic in the bond market right now that most retail income investors have not fully absorbed, and it is the one I would flag as most likely to surprise someone in the wrong way.
When people look at high-yield bond funds — junk bonds, in plain English, meaning bonds issued by companies whose credit isn't rated investment-grade — and see total yields in the 7% range, the natural reaction is "that looks like real income." It does. But yield alone is half the picture. The other half is the spread: the gap between what junk bond holders are getting paid and what Treasury holders are getting paid. That gap is what compensates investors for the actual credit risk of lending to companies that might not pay them back.
As of mid-May, that spread is sitting at roughly 2.76% — meaningfully below its long-term average of 5.19%. Roughly one standard deviation below the historical norm. Translation: investors who are buying junk bonds right now are being compensated for the credit risk they are taking at near-historically-low levels.
This is sustainable as long as the economy keeps growing, default rates stay near their current ~1.89%, and the energy shock does not flip into a stagflation episode that damages corporate cash flows. If oil stays above $100 a barrel for six to nine months — a credible scenario given the war backdrop — the combination of margin compression, consumer pullback, and higher refinancing costs could push corporate defaults meaningfully higher. At that point, spreads widen from historically tight levels, and the investor who bought for the carry can face credit losses and duration losses simultaneously.
The HY spread trap is not a prediction. It is a structural condition: a yield level that looks attractive in absolute terms is built on a credit risk premium that may not be holding much margin for error. For an income investor in the fragile decade, the math of being wrong about this is worth understanding before — not after.
Why Our Design Exists
The three questions above — how long have you owned what you own, what is your duration, can you reinvest at the new rates — are not just an analytical framework for an article. They are the operational variables any disciplined fixed-income approach has to account for in real time. That is what AGG's fixed-income design is built around.
The Fixed-Income Side
For clients who hold AGG-managed fixed income for income generation, our fixed-income module within the broader ATS framework monitors regime-change signals on a continuous basis and rebalances positioning weekly. The cadence matches what fixed-income markets actually demand. Rates don't move by the minute the way stocks do. They shift in regimes — periods of weeks and months where the underlying conditions favor different parts of the yield curve, different credit profiles, and different durations. A weekly rebalance captures those shifts without churning the portfolio against itself.
What that looks like in an environment like this one is a portfolio whose duration, credit exposure, and reinvestment posture are continuously aware of the conditions the three questions describe. When the breakeven math turns against long duration, the design reduces duration exposure. When the reinvestment opportunity opens at the longer end of the curve, the design preserves the capacity to capture it. When credit spreads sit at historically tight levels relative to fundamentals, the design treats that as a signal, not as free income. The point is not that we predict where yields go next. The point is that the portfolio is built to respond to actual conditions in the bond market rather than to a static glide path written in a different rate regime.
For clients who want a pure bond posture rather than the broader ATS framework, AGG also runs a standalone fixed-income offering. Same ETF-based implementation. Same regime-aware logic and weekly rebalance cadence. The mandate is the difference — the standalone offering is bonds-only, calibrated to a portfolio whose entire job is fixed-income exposure.
The Equity Side — Tomorrow's Story
The equity module of the ATS is a different design for a different job. It monitors risk signals throughout every trading day. Every thirty minutes, the system checks its defensive positions to make sure they remain in harmony with the current shape of the yield curve. This is a readiness check, not a portfolio rebalance. The point is to keep the defensive positions properly calibrated to current conditions, so that if rotation out of equities becomes necessary, those positions are already in the right shape. The yield curve is the most important real-time signal of where institutional capital is moving and what it is pricing about growth, inflation, and policy. A defensive equity posture that isn't aligned with what the bond market is saying is, by design, missing half the picture.
That continuous monitoring across both sides narrows exposure to severe drawdowns. It does not eliminate it — no system does — and we take every measure practicable to keep the math of recovery on the client's side.
The case is not that we know what bonds do next, or what equities do next. The case is that markets where the textbook breaks down — where the "safe" asset is selling off alongside stocks, where the correlation that justified the 60/40 portfolio just inverted in real time — are exactly when a retirement account benefits from a design that listens to the actual signals rather than running a glide path written years ago in a different rate regime.
What's Coming Tomorrow
Part 2 turns to what is actually driving the regime change we have been describing — the Iran-and-oil inflation backdrop, the fiscal picture (a national debt approaching $40 trillion, deficits running at roughly 8% of GDP, and AI hyperscalers alone expected to add about $2 trillion in corporate bond supply this year), and the Kevin Warsh Fed regime change that became official this past Friday when Jerome Powell's term ended.
It also turns to the part most equity investors have not fully absorbed yet. A "risk-free" rate that has reset materially higher does not just change the bond market. It changes the cost of capital for every public company — with long-term implications for equity valuations, and especially for businesses that depend on debt financing to grow. The flip side is the compression of equity leadership into a handful of trillion-dollar names whose cash stockpiles let them ignore the new rate regime entirely. We will walk through what that means for the fragile decade tomorrow.

Take Action
If reading this raised questions about your own bond exposure — whether the "safe" portion of your portfolio is doing what you think it's doing, whether the diversification you own is the diversification your plan assumes — I'd welcome that conversation. Reply to this email, call the office, or schedule a review here. You can also see how our defense-first investment system works at assetguidancegroup.com/ats-mgmt-landing-page-347034. For direct contact: [email protected].
Part 2 publishes tomorrow.
───This post originally appeared on The Lighthouse on Substack — weekly financial analysis written specifically for people within ten years of retirement. Subscribe free at The Lighthouse on Substack or upgrade for weekly Trades of the Week picks.───
Investing involves risk, including the possible loss of principal. This article is for informational purposes only and does not constitute personalized investment advice. Past performance is not indicative of future results. Fixed income investments are subject to interest rate, credit, inflation, and liquidity risks.
Wallace R Nichols, MBA, JD, CFP Chief Investment Officer Asset Guidance Group, LLC, a registered investment advisor