Washington Just Started Buying Back Its Own Long Bonds
What the Treasury's September move actually does, why today's bond auction told a different story, and who else is competing for the same lenders
Part 1 of a two-part series. Part 2 runs tomorrow.
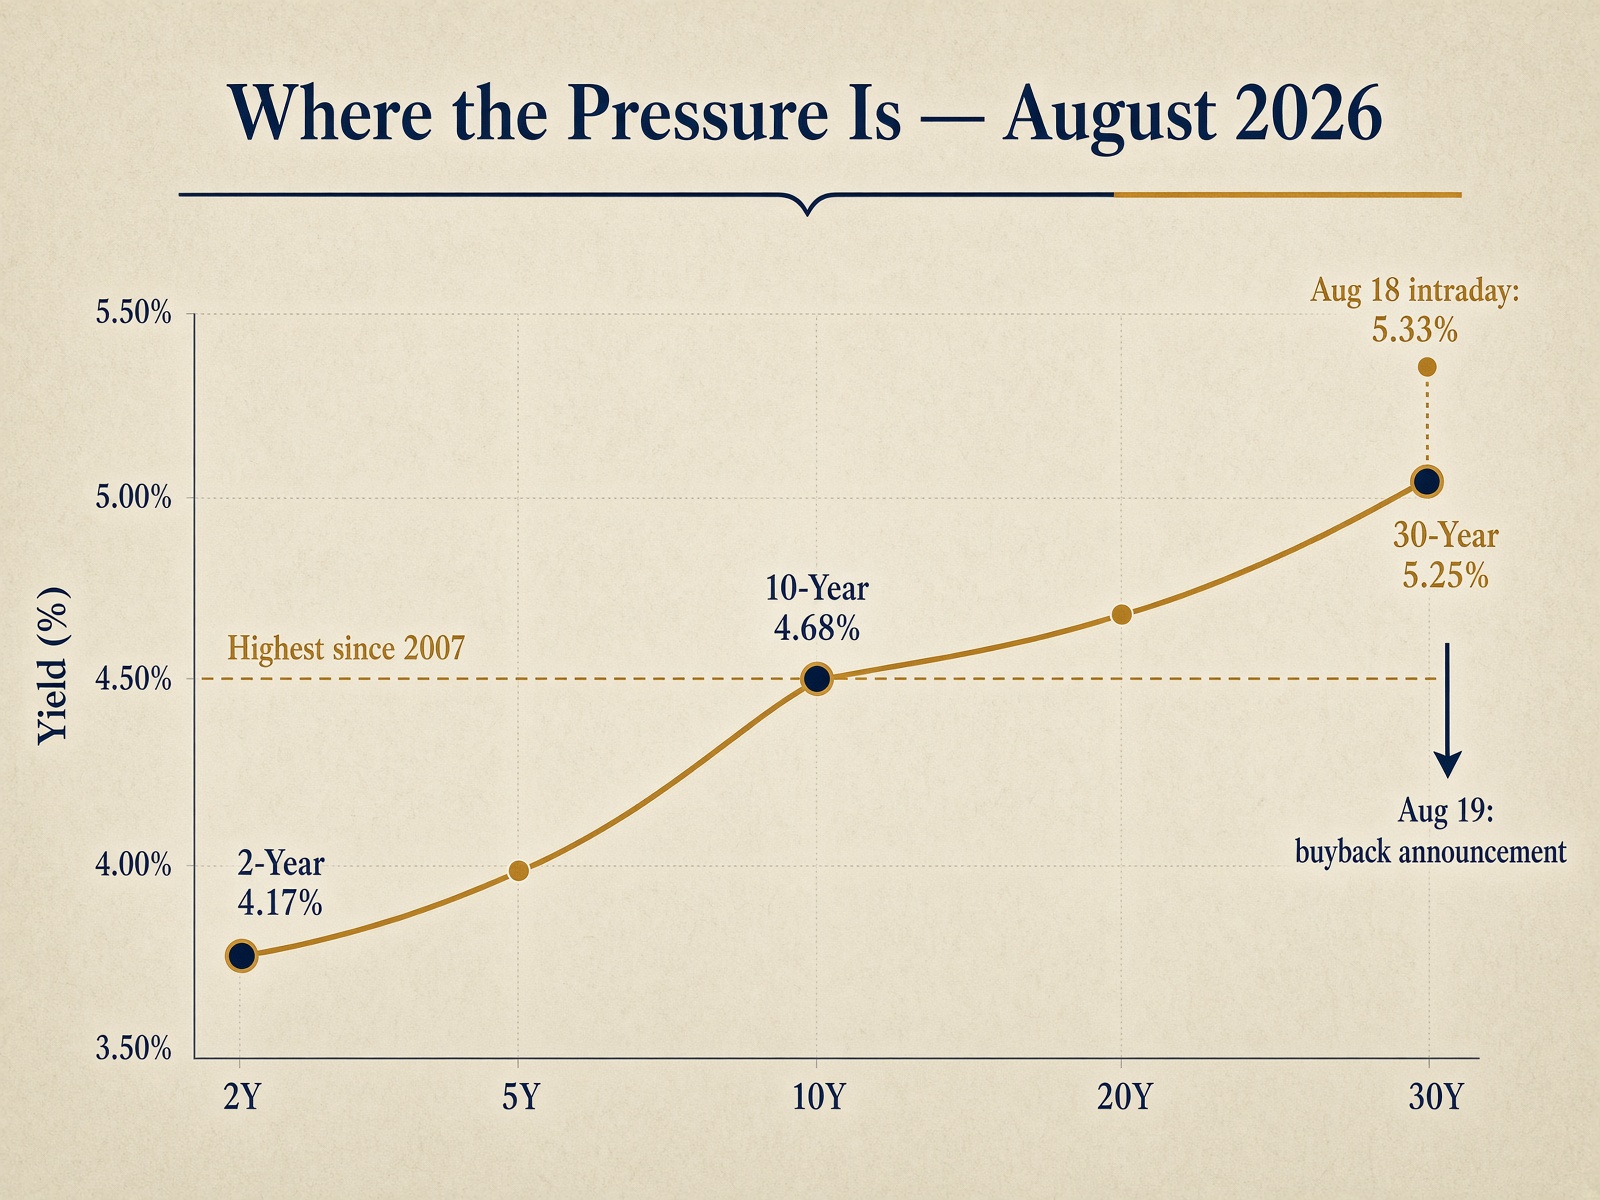
Yesterday was a rough day at the long end of the bond market. The 30-year Treasury yield touched 5.33% — its highest level since 2007 [Treasury par yield curve / market reporting, 2026-08-18]. Stocks slid for a third straight session, and semiconductor shares dropped more than five percent in a single day [market reporting, 2026-08-18].
If you have been watching your statement through this stretch and wondering when the long bond selloff finally breaks, yesterday did not feel like an answer.
This morning, the Treasury Department made a move. A few hours later, the bond market gave its own verdict.
What Happened
The U.S. Treasury announced it will at least double the size of its buyback operations for long-dated bonds. Where each operation was capped at $2 billion, it can now be at least $4 billion. The change takes effect September 9 and runs through November 4 [U.S. Department of the Treasury, press release sb0607, 2026-08-19].
What a Buyback Actually Is
A Treasury buyback is exactly what it sounds like. The government goes into the open market and repurchases bonds it already issued. It focuses on older bonds that have been trading for a while and do not change hands as easily as the newest ones — the market calls these "off-the-run" bonds. Buying them back is meant to clear out the clogged corners of the market so that trading in long bonds works more smoothly.
Here is the part that matters, and it is the part most headlines skip. This is not debt reduction. Treasury has to pay for those repurchases, and it pays for them by issuing something else — mostly short-term Treasury bills and shorter notes. Auction sizes for the longer maturities were left unchanged in the August refunding [U.S. Treasury Quarterly Refunding Statement, 2026-08-05]. So the total amount the government owes does not shrink. What changes is the shape of the debt: Treasury is buying long and borrowing short.
The market took it as a signal anyway. The 30-year yield fell roughly eight basis points on the announcement, and the 10-year fell about five [CNBC, 2026-08-19]. A basis point is one-hundredth of one percent, so eight basis points is 0.08%.
The timing is worth noticing, and I will let you draw your own conclusion. The announcement came out on the morning of a scheduled $16 billion 20-year bond auction. Twenty-year yields fell about eight basis points on the news, and the auction a few hours later priced at 5.204% — the second-highest yield ever recorded at a 20-year sale, just under the October 2023 record of 5.245% [U.S. Treasury auction results, 2026-08-19]. Without the morning's move, it would likely have set a record. Some strategists read that sequence as deliberate management of a difficult auction; Treasury describes the buyback purely as liquidity support and has not tied it to any auction. Both readings are available on the same facts.
Why the Long End Was Under Pressure to Begin With
The buyback is a response to something real. Three pressures have been stacking up on long-dated Treasury bonds all year.
The first is supply. The federal deficit for fiscal 2026 is tracking around $2 trillion [Congressional Budget Office, 2026 baseline and August update]. Every dollar of that has to be borrowed from somebody, and the government has been coming to market relentlessly. On August 13, the Treasury sold 30-year bonds at a yield of 5.216% — the highest yield at a 30-year auction since 2001 [U.S. Treasury auction results, 2026-08-13].
The second is that some of the largest buyers have been stepping back. Foreign holdings of Treasury securities fell by $72.1 billion in June, the third decline in four months. China's holdings dropped to their lowest level since 2008 [U.S. Treasury International Capital data, released 2026-08-17]. These were the price-insensitive buyers — the ones who bought because they had to, not because the yield looked good. Fewer of them means the rest of the market has to be paid more to take the bonds.
The third is that the Federal Reserve is not filling the gap. Balance sheet runoff ended in December 2025, but the Fed has been reinvesting into short-term bills, not long bonds [Federal Reserve balance sheet policy, 2025-12 forward]. The policy rate has sat at 3.50–3.75% since December [Federal Reserve, FOMC]. At the July meeting, the committee held rates 9–3 — and all three dissenters wanted a hike [FOMC statement, 2026-07-29]. Nobody is riding to the long end's rescue.
What Today's Auction Told Us
The auction itself is worth a moment, because it is the cleanest read available on whether these yields are high enough to attract real buyers.
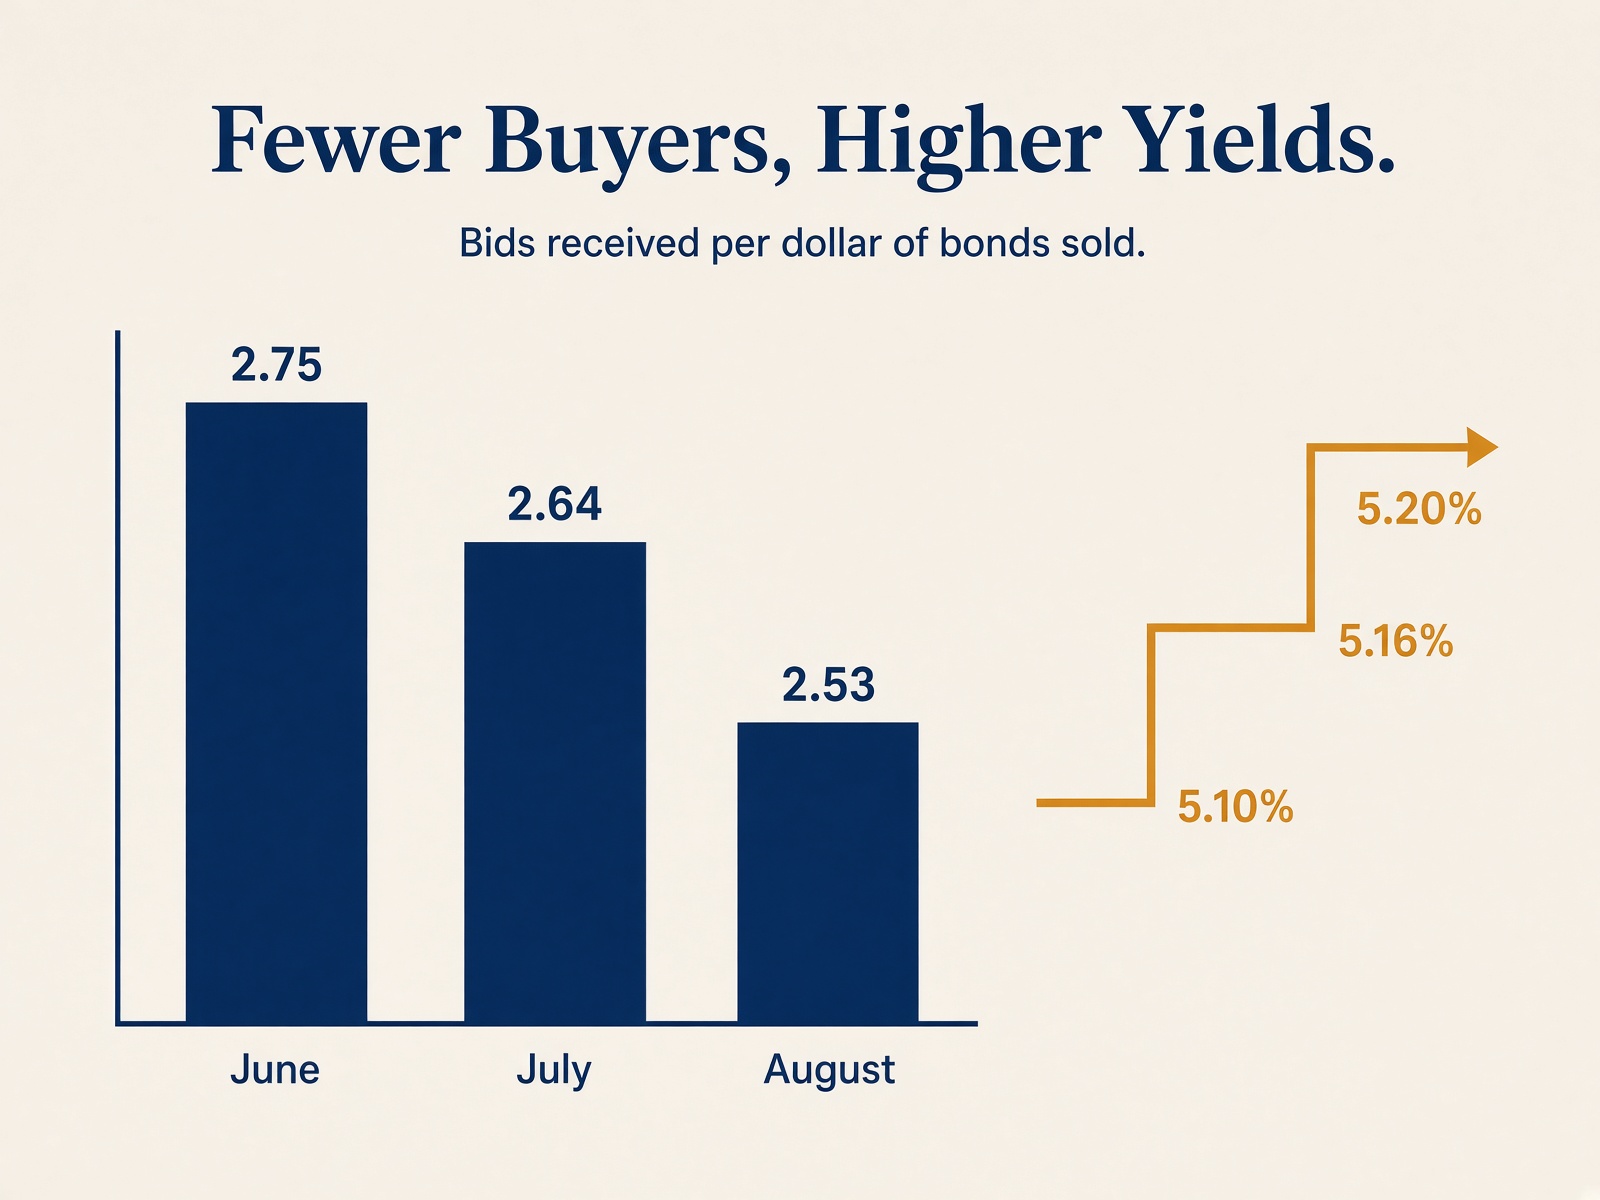
The answer today was: not quite. The sale priced about half a basis point above where the market had been trading it beforehand — a small "tail," in the jargon, meaning Treasury had to concede slightly more yield than expected to place the bonds. And the bid-to-cover ratio, which measures how many dollars of bids arrived for each dollar of bonds sold, came in at 2.53. That was down from 2.64 in July and 2.75 in June [U.S. Treasury auction results; ZeroHedge market recap, 2026-08-19].
Three months of softening demand, in other words, at progressively higher yields. That is what a market repricing the compensation it requires for long-term lending looks like from the inside. It does not tell you the long end has stopped selling off. If anything it suggests buyers are still waiting to be paid more.
For the reader weighing 5.2%, that is the argument for patience rather than urgency — not because the yield is unattractive, but because nothing in today's result suggests it is the last chance to get it.
What It Means for You
There Is Another Very Large Borrower in the Room
The Treasury is not the only one showing up at the long end of the market this year. The companies building out artificial intelligence infrastructure have become one of the biggest borrowers on earth.
The five largest technology issuers sold a record $159 billion of bonds through early June 2026. For the whole of 2025, the same five issued $121 billion [BofA Securities data, reported by Reuters, June 2026]. One Wall Street estimate puts total hyperscaler bond issuance for 2026 near $400 billion, more than double last year [Morgan Stanley research, 2026]. Technology now accounts for roughly 18% of all U.S. investment-grade corporate bond issuance, up from a small fraction two years ago [BofA Securities data, 2026].
And these are not short-term loans. The maturities on this tech issuance run about three and a half years longer than the market average [BofA Securities data, 2026]. One issuer sold a hundred-year bond [company issuance reporting, February 2026].
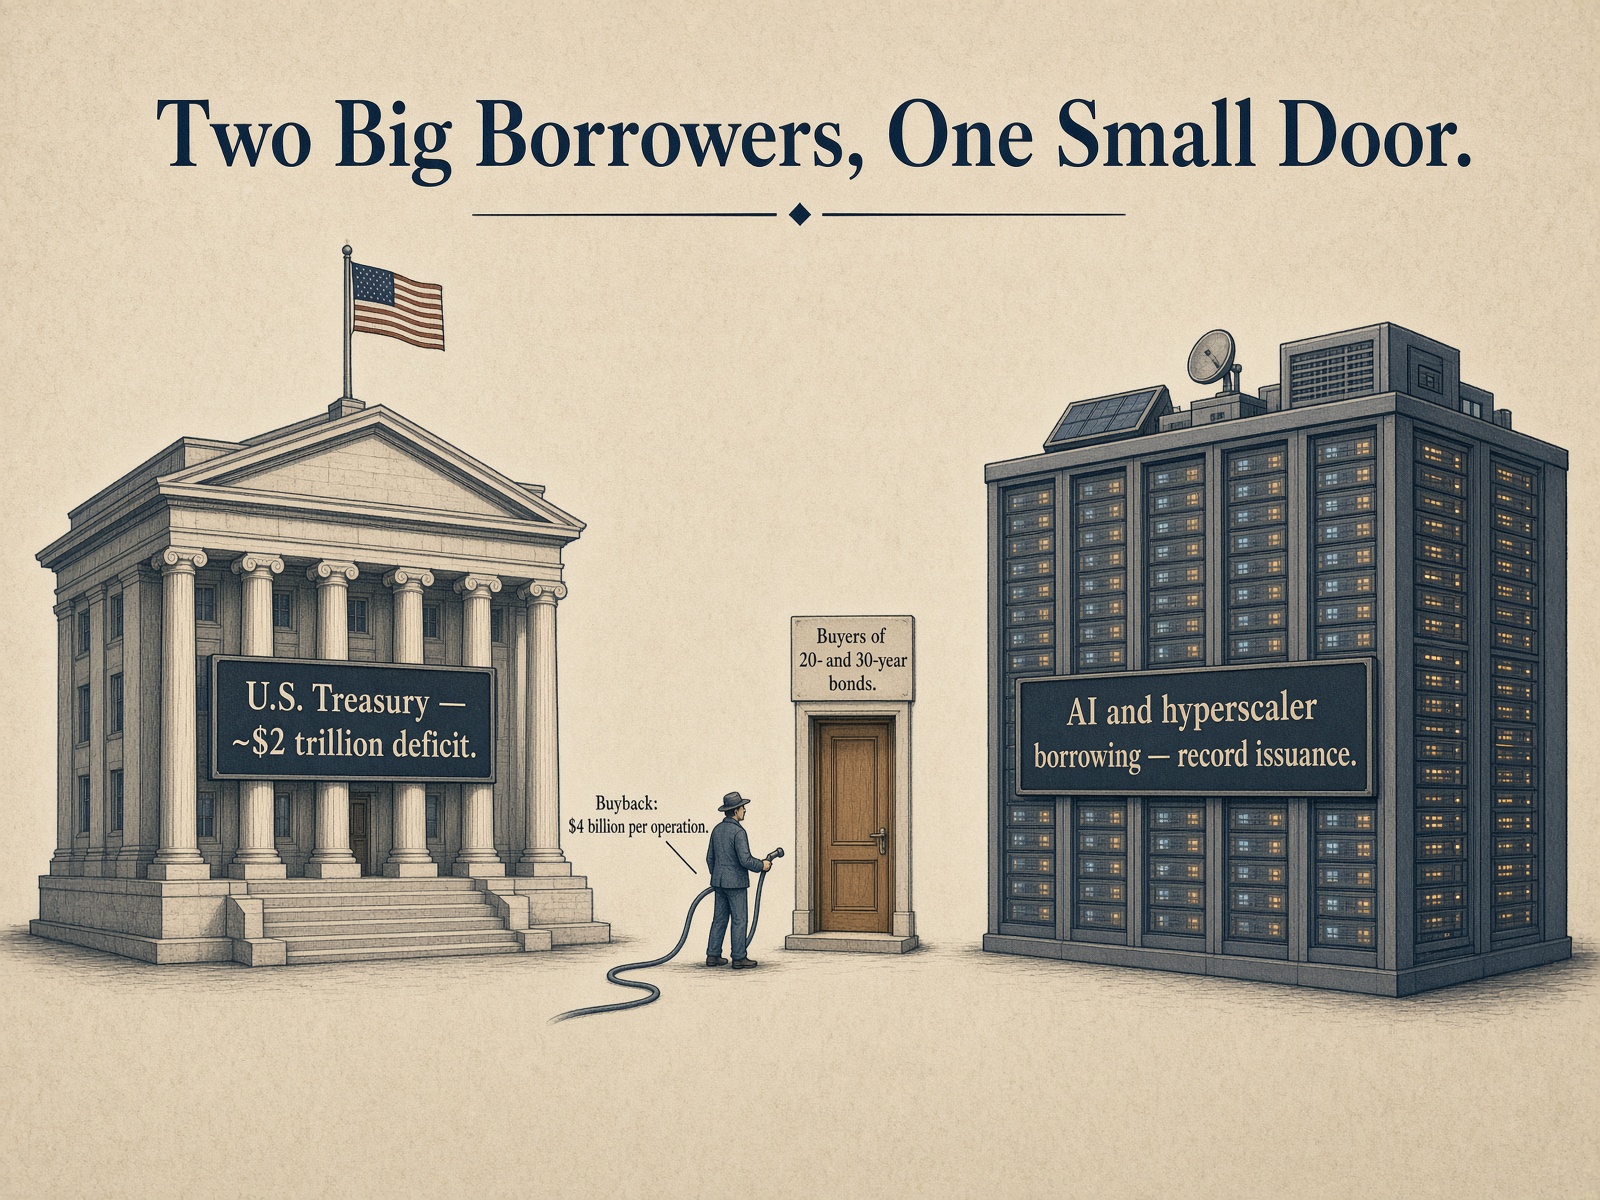
That matters because there is a limited pool of investors willing to lend money for twenty and thirty years — mostly pension funds and insurance companies, who need long assets to match long promises. When two enormous borrowers show up at that same window in the same year, the price of borrowing goes up for both of them.
Which puts the buyback in proportion. Four billion dollars per operation, against a $2 trillion deficit and a corporate borrowing wave measured in hundreds of billions, is a garden hose pointed at a structural problem. It helps the plumbing. It does not change the arithmetic.
What Higher Long Rates Do to Stocks
There is a mechanical link between the 30-year Treasury yield and what a share of stock is worth, and it is worth understanding because it explains a lot of what has happened this month.
A stock is worth the cash the company will produce in the future, converted into what that future cash is worth today. The conversion uses an interest rate. When that rate goes up, future cash is worth less right now — and the further into the future the cash arrives, the more it gets marked down. Companies whose value depends on profits many years out get hit hardest. That describes a great deal of what has been leading this market.
The S&P 500 closed Monday at 7,745, trading at roughly 20 times expected earnings — above both its five-year and ten-year averages [FactSet Earnings Insight, 2026-08-07; market data, 2026-08-17]. The ten largest companies make up close to a third of the index [index data, August 2026]. That is a market priced for a friendly discount rate, concentrated in exactly the names most sensitive to it.
There is a second thread here worth naming. For years, the AI buildout was funded out of company cash flow. Increasingly it is funded with borrowed money. That changes the nature of the risk. Cash-funded spending is a shareholder question — if it does not pay off, the stock disappoints. Debt-funded spending is a lender question. If it does not pay off, there are interest payments due regardless. That may work out entirely fine; these are among the most profitable enterprises ever built. But it is a different risk than the one investors were carrying two years ago, and it deserves to be watched rather than assumed.
Why This Lands Differently Inside Ten Years of Retirement
If you are thirty-five, a bond selloff and a stock wobble are weather. You keep contributing, and time does the repair work.
If you are sixty-two, the calendar is less generous. Money that has to start supporting income in a few years cannot spend those years recovering from a hole. That is what makes this stretch uncomfortable in a way it would not have been earlier in your working life — and it is why the response has to be structural rather than emotional.
Tomorrow
Everything above describes the weather. Tomorrow's article is about what to do standing in it.
Long Treasuries now pay more than they have in twenty years, and a great many people within ten years of retirement are looking at 5.2% and wondering whether to reach for it. There is a real answer to that question, and it involves a number almost nobody is shown — the point in time at which a rise in yields stops hurting you and starts helping you. For a 30-year bond bought today, that number lands somewhere most 62-year-olds will find sobering.
Tomorrow also takes up the question clients have been asking all year, and the one that prompted this series: if the income keeps arriving every month, why has the balance been drifting down — and how do you tell the harmless version of that from the one that should worry you? They look identical on a statement. They are not remotely the same thing.
Take Action
If you are reading this in your email, the ❤️ heart button, the comment box, and the share buttons are not here — they live on the Substack version of the post. One click and they appear. It takes two seconds, and a like or a share is what helps The Lighthouse reach more people in the fragile decade. While you are there, subscribe so tomorrow's Part 2 lands in your inbox, leave a comment with whatever question this raised, or share the post with someone whose bond allocation is longer than they realize.
If this raised a question about your own situation, that is a conversation worth having. Reply to this email, call the office, or schedule a review here. You can also see how our defense-first investment system works at assetguidancegroup.com/ats-mgmt-landing-page-347034. For direct contact: [email protected].
───This post originally appeared on The Lighthouse on Substack — weekly financial analysis written specifically for people within ten years of retirement. Subscribe free at The Lighthouse on Substack or upgrade for weekly Trades of the Week picks.───
Investing involves risk, including the possible loss of principal. This article is for informational purposes only and does not constitute personalized investment advice. Past performance is not indicative of future results. Fixed income investments are subject to interest rate, credit, inflation, and liquidity risks. Equity investments are subject to market risk and may decline in value, sometimes significantly, over short or extended periods.