
The Twist
Everyone Is Watching the Wrong End of the Yield Curve
The 30-year bond just drew its strongest demand of the year. The real fight is happening at the short end — and that is what decides the fourth quarter.
There is a rhythm to the morning here. The screens come up before the market does, and the first task is less about reading numbers than deciding which ones to set aside. On most days the headline yield everyone quotes is the least useful figure on the page. What carries information is the relationship between maturities, and whether that relationship is still telling the story it was telling a month ago.
This week it is not. And the story it has switched to is one almost nobody is repeating on television. So let me walk you through what I am actually seeing, and what it means for the money you are counting on.
What Actually Happened
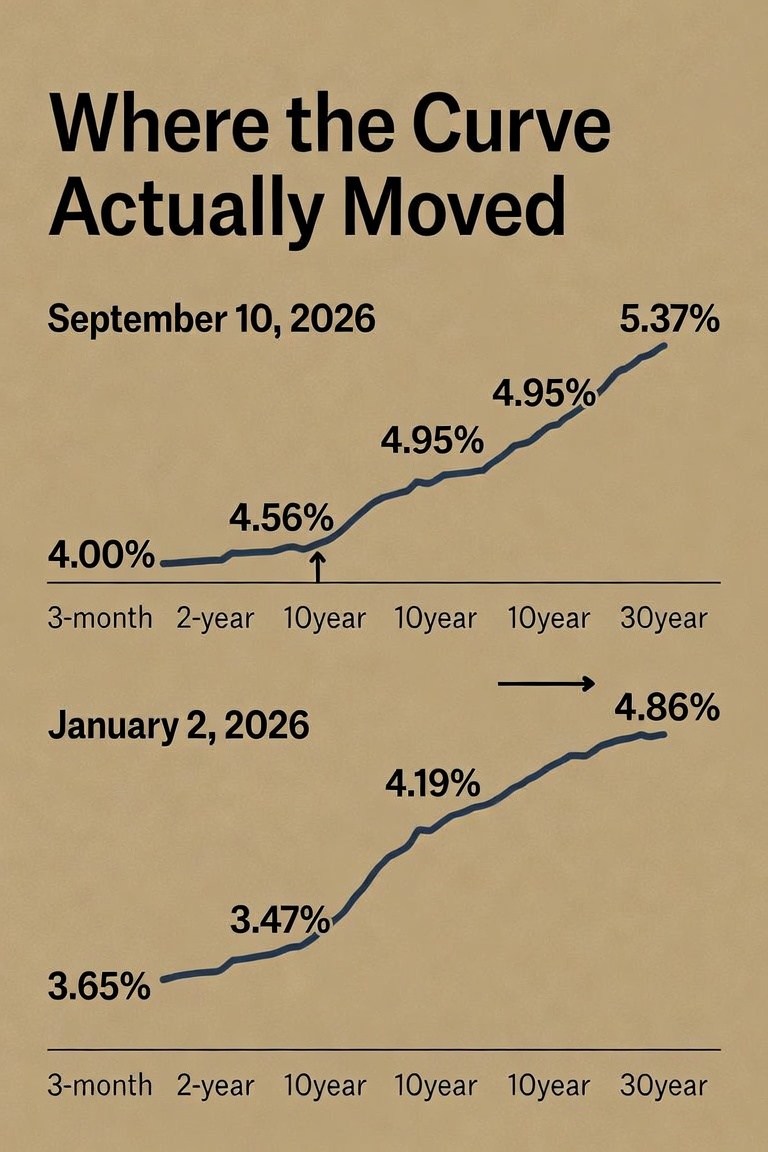
The headline is easy to find. The 10-year Treasury yield reached about 4.95%, the highest since 2023 [U.S. Treasury daily par yield curve, 2026-09-10]. The 30-year sits near 5.37%. The average 30-year fixed mortgage is running close to 6.8%, and the S&P 500 fell for a fourth straight session [Freddie Mac Primary Mortgage Market Survey via FRED, September 2026; CNBC market coverage, 2026-09-10]. Oil above $100 and an August inflation reading of 3.4% are the backdrop [BLS Consumer Price Index, August 2026].
That is all true. It is also not the interesting part.
The Number Everyone Quoted, and the One That Mattered
Here is what the two rows on my screen show. Since the first session of January, the 3-month bill has risen about 35 basis points. A basis point is one one-hundredth of a percent, so that is about a third of a percent. The 2-year has risen 109. The 10-year, 76. The 30-year, 51 [U.S. Treasury daily par yield curve, 2026-01-02 through 2026-09-10].
Read that sequence again, because it runs backward from the story you have been told. The 30-year moved least. The 2-year moved most — twice as much as the long bond.
For most of this year the popular explanation has been what economists call fiscal dominance: deficits are enormous, the government must sell an overwhelming amount of long-term debt, and investors are demanding more compensation to hold it. That theory makes a specific, testable prediction. It predicts the long end leads. It predicts the gap between short and long yields widens.
The gap narrowed. At the start of January, the 30-year paid 139 basis points more than the 2-year. It now pays 81. That relationship has compressed by 58 basis points this year [U.S. Treasury daily par yield curve]. The curve is steep, and it has been getting less steep all year. Those are two different statements, and the difference matters enormously for what you own.
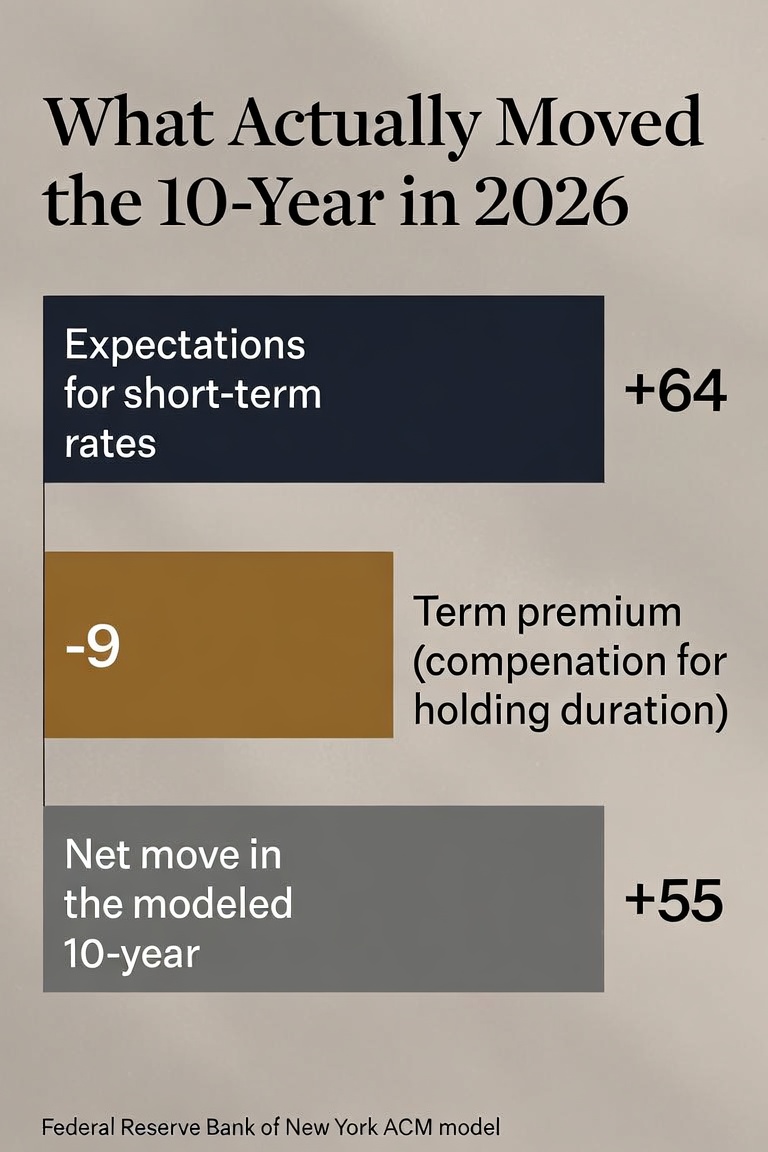
There is a way to check this directly rather than argue about it. The Federal Reserve Bank of New York publishes a model that splits any Treasury yield into two pieces: the part that reflects where investors think short-term interest rates are headed, and the part that is pure extra compensation for tying money up for a long time. That second piece is called the term premium.
Run the 10-year through it. Year to date, the expectations piece is up about 64 basis points. The term premium piece is down about 9 [Federal Reserve Bank of New York, ACM term premium series, 2026-09-09].
The entire move, and then some, is the market changing its mind about the Federal Reserve. Not about the deficit.
The Auction That Broke the Narrative
The second thing that did not match the story happened Thursday.
Every month the Treasury auctions long-term bonds. Most coverage reports one number: the yield the bonds sold at. That number has been climbing all year, and climbing yields get reported as failing auctions.
The yield is the least useful number in the report. A rising yield only tells you buyers want to be paid more. It cannot tell you whether buyers showed up.
For that you look at who bought. Primary dealers are a small group of banks required to bid at every auction. They are the buyer of last resort. When real investors step back, dealers get stuck with the paper, and their share climbs. That is the actual distress signal. At the other end, indirect bidders are largely foreign central banks and large institutions — the patient money.
Through the spring and summer, the 30-year auctions ran with dealers absorbing roughly nine to fifteen percent, and indirect bidders taking somewhere between 53% and 70%. On September 10, at a yield of 5.31%, indirect bidders took 79.3% — the highest of 2026 — and dealers were left with 2.2%, the lowest of the year. Bids exceeded the amount offered by 2.61 times, also the strongest reading of 2026 [TreasuryDirect auction results, 2026-09-10].
That is not a buyers' strike. That is a queue. The world is not refusing to lend to the United States for thirty years. It is refusing to do it at four and a half percent, and lining up to do it at five and a third.
Two Agencies Pulling the Same Rope in Opposite Directions
Which brings me to the part that makes this genuinely unusual.
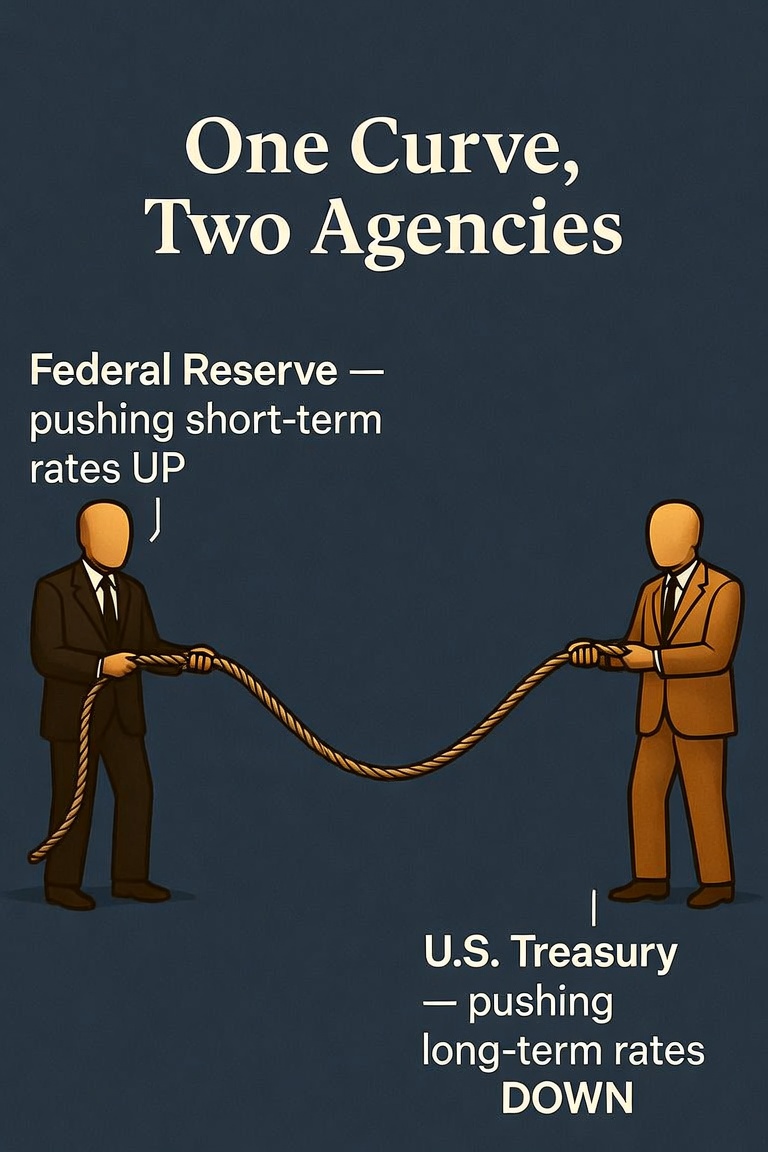
The Treasury Department has been buying back its own long-term bonds, a program it expanded in August to at least double the prior size, running from September 9 through November 4 [U.S. Department of the Treasury, 2026-08-19]. Secretary Bessent has said the department has a large toolkit and that current yields do not reflect the underlying fundamentals. The first enlarged operation ran on September 9 with a $6 billion ceiling. Dealers offered roughly $10.5 billion. Treasury bought $5.19 billion. Yields rose anyway [CNBC, 2026-09-09].
There is a name for this maneuver, and it comes with a dance step attached. In 1961 the Federal Reserve tried something it called Operation Twist, borrowing the name from the dance everyone was doing that year. The idea was simple enough to explain at a kitchen table. The government bought up its own long-term bonds and paid for them by issuing short-term ones. It did not borrow less, and it did not put more money into the system. It only changed the mix of what it owed — less long-term debt outstanding, more short-term debt. The theory is that if investors are holding fewer long bonds, the ones left behind become more valuable, and long-term interest rates come down while short-term rates stay where the Fed put them. You twist the two ends of the curve in opposite directions. Hence the name.
What Secretary Bessent is running is a twist in everything but the letterhead. Buy back the long bonds, fund it with short-term bills, change the mix rather than the total. The differences are that it is the Treasury doing it rather than the Fed, and that the amounts so far are small. A $5 billion purchase lands in a market that trades more than a trillion dollars a day, against tens of billions in new long bonds sold every quarter. That is a signal, and signals matter. But it is not enough weight to set a price, which is why the yield went up on the day the buying happened.
Meanwhile the Federal Reserve, under Chair Kevin Warsh since May, is weighing the opposite move. Markets went into this week pricing roughly two-in-three odds that the Fed raises rates at its September 16 meeting, which would be the first increase of this cycle.
So one arm of the government is working to push long-term borrowing costs down while another prepares to push short-term borrowing costs up. A senior research executive at JPMorgan put the tension to CNBC plainly, comparing the approach to paying a mortgage with a credit card — workable for a while, until the mismatch starts to show [CNBC, 2026-08-21].
This is not a coordinated plan. It is a jurisdictional disagreement about who sets the price of money, being conducted in public, in the middle of your retirement account.
What This Means for the Money You Are Counting On
Why Your Bond Statement Looks Wrong
Start with the mechanic that confuses more pre-retirees than anything else I discuss in this office.
Bond prices and bond yields move in opposite directions. Always. A bond pays a fixed dollar amount. If newly issued bonds start paying more, the older bond paying less is worth less to a buyer. Yields up means prices down.
So yes — yields up, prices down. If you own bond funds, particularly those holding long-dated bonds, your statement reflects that. Nothing is broken. That is the arithmetic working exactly as designed.
The part worth sitting with is that the same movement is simultaneously good news, depending on which bucket of your money you are asking about. Money already invested in long bonds took a price hit. Money you are investing now is being offered the best income terms in nearly twenty years. A retiree building an income stream today is being paid materially more than one who built it in 2021. Those are not contradictory statements. They are the same fact viewed from two different positions on the timeline.
Can Stocks Go Up While Yields Go Up?
For a while, yes. And this is where I want to be careful with you.
Stocks and bonds compete. When a government bond pays five percent with the full backing of the Treasury, every stock has to justify itself against that alternative. Higher yields also compress what investors are willing to pay for future earnings, because those earnings are worth less when discounted back at a higher rate.
But competition is not an instant verdict. Through much of 2026 stocks rose alongside yields, because earnings — particularly among the large technology companies building artificial intelligence infrastructure — grew fast enough to outrun the rising discount rate. That can persist. It has persisted. Markets sat at record levels as recently as September 9.
What changes the arithmetic is when yields rise for reasons that also threaten earnings, or when they cross the level where the comparison stops being close. The four-session decline into September 10 arrived precisely as the 10-year approached 5%. That is the number I am watching, and I would rather tell you that plainly than pretend to a precision nobody has.
The Competition for Capital
There is a second squeeze underneath this one, and it rarely makes the evening news.
The same technology companies driving the market's gains are borrowing enormous sums to build data centers. JPMorgan's analysis put 2026 issuance from the largest of them at roughly $320 billion, of which about $310 billion is long-dated — approximately 70% of the long-term borrowing the Treasury itself is doing this year [JPMorgan Asset Management commentary, 2026]. Secretary Bessent has named this directly, calling it a short-term competition for capital.
Every dollar that buys a twenty-year corporate bond is a dollar not buying a twenty-year Treasury. The buyers of long-duration debt are a finite pool, and the pool is being asked to fund two building programs at once: the federal deficit and the AI buildout. That is a real reason long-term rates have a floor under them that a $5 billion buyback cannot lift.
Where the Real Retirement Risk Actually Lives
Now the part that matters most, and the part I want to be precise about rather than dramatic.
There is a genuine hazard for people near retirement called sequence-of-returns risk. It is not simply that markets fall. Markets fall regularly and recover. The hazard is falling markets combined with withdrawals. If you are pulling income from a portfolio while it is down, you sell more shares to raise the same dollar, and those shares are permanently gone. The account can be mathematically unable to recover even when the market fully does. A decline at 35 gets repaired by time. A decline at 63, while you are drawing on it, may not.
That is why the ten years surrounding your retirement date deserve different handling than the thirty years before them.
But I want to draw the boundary honestly, because the boundary is where most commentary goes wrong. Not every decline is a sequence-of-returns event. A drawdown in money you are not touching, with no withdrawals coming out, is recoverable — that is a fluctuation, not an impairment. The risk attaches specifically to capital in or near the withdrawal phase. Conflating the two produces panic in people who should be patient, and complacency in people who should not be.
Which of your accounts sits in which category is not a market question. It is a planning question, and it is answerable.

What We Are Doing About It
Watching, Not Forecasting
I do not know whether the Fed raises rates on Tuesday. Nobody does, including the people who will vote.
What I can tell you is how the chair I sit in is set up. Our investment system is rules-based and reviews market conditions throughout every trading session, so that positioning responds to what conditions actually are rather than to what I hoped they would be at the start of the quarter. Continuous monitoring narrows exposure; it does not eliminate it — no system does — and we take every measure practicable. Discipline of this kind earns its keep precisely when overriding it feels most justified.
On the fixed-income side, our posture has favored shorter-dated bonds, which are structurally less sensitive to exactly the kind of long-end movement this year has delivered. Shorter maturities are not free of risk — they carry reinvestment risk if rates fall, and no allocation is without trade-offs — but the choice has aligned with the environment. A point worth correcting while I am here: shorter duration has not meant giving up income. It has been possible to build short-dated fixed income yielding competitively against the 30-year, which is an unusual feature of this particular curve and will not persist indefinitely.
The Fourth Quarter, Written on the Calendar
Q3 closes in under three weeks, and Q4 is unusually dense with scheduled events rather than surprises. The Fed meets September 16, again October 27 and 28, and again December 8 and 9. The Treasury's expanded buyback window expires November 4, the same day it announces its next quarterly borrowing plans. Midterm elections fall November 3. Government funding runs out December 11.
That is six dates that can move your account, all of them known in advance. The market's job over the next hundred days is to price them. My job is to make sure the portfolio does not depend on guessing them correctly.
If there is one idea I would like you to carry out of this: the bond market is not broken. It repriced. Buyers came back in force this week once the price was right. The unresolved question is not whether anyone will lend to America. It is which arm of the government sets the terms — and that question gets answered, one way or another, before the year ends.
Take Action
If you are reading this in your email, the buttons are not here. The ❤️ heart, the comment box, and the share links all live on the Substack version of the post. Click through and it takes about two seconds — and a like or a share genuinely helps The Lighthouse reach more people in the ten years before retirement who are trying to make sense of a market like this one. While you are there, you can subscribe if you have not, leave a comment with the question this raised, or share the post with someone whose bond statement confused them this quarter.
If this raised questions about your own situation — whether your bond exposure is positioned for this curve, whether your equity concentration is greater than your statement suggests, or whether the money funding your retirement is in the bucket that needs protecting versus the bucket that can wait — I would welcome that conversation. Reply to this email, call the office, or schedule a review here. You can also see how our defense-first investment system works at assetguidancegroup.com/ats-mgmt-landing-page-347034. For direct contact: [email protected].
───This post originally appeared on The Lighthouse on Substack — weekly financial analysis written specifically for people within ten years of retirement. Subscribe free at The Lighthouse on Substack or upgrade for weekly Trades of the Week picks.───
Investing involves risk, including the possible loss of principal. This article is for informational purposes only and does not constitute personalized investment advice. Past performance is not indicative of future results. Fixed income investments are subject to interest rate, credit, inflation, reinvestment, and liquidity risks. Equity investments are subject to market risk and may decline in value, sometimes significantly, over short or extended periods. Yields and market levels referenced are as of the dates indicated and change continuously.
Wallace R Nichols, MBA, JD, CFP Chief Investment Officer Asset Guidance Group, LLC, a registered investment advisor