
Where Did the Safe Havens Go?

Asset Guidance Group | March 2026
Monday morning felt like any other.
Markets were holding. The economic calendar looked manageable. A client called — not panicked, just skeptical. That morning we had shifted her portfolio to a more defensive posture. She wanted to know why.
"Everything looks fine," she said. "Why are we playing defense?"
It was a fair question. Defensive positioning always feels wrong when things are calm. You look overly cautious. Maybe even a little out of touch.
By Tuesday, the picture had started to shift. By Wednesday, it had changed completely again. Thursday brought more chop — directionless, exhausting — before things turned markedly worse. By Friday morning, the week had made its verdict clear.
She called back Friday. I didn't need to explain much. The week had done that for me.
That conversation — and weeks like it — is what professional portfolio management is really about. Not the specific moves. Not the mechanics. The why — why having a disciplined process matters not for the calm weeks, but for the ones that look like this one did by the time Friday closed.
The Week in Numbers
Let's start with the facts, because the data tells a remarkable story.
Two shocks hit markets almost simultaneously.
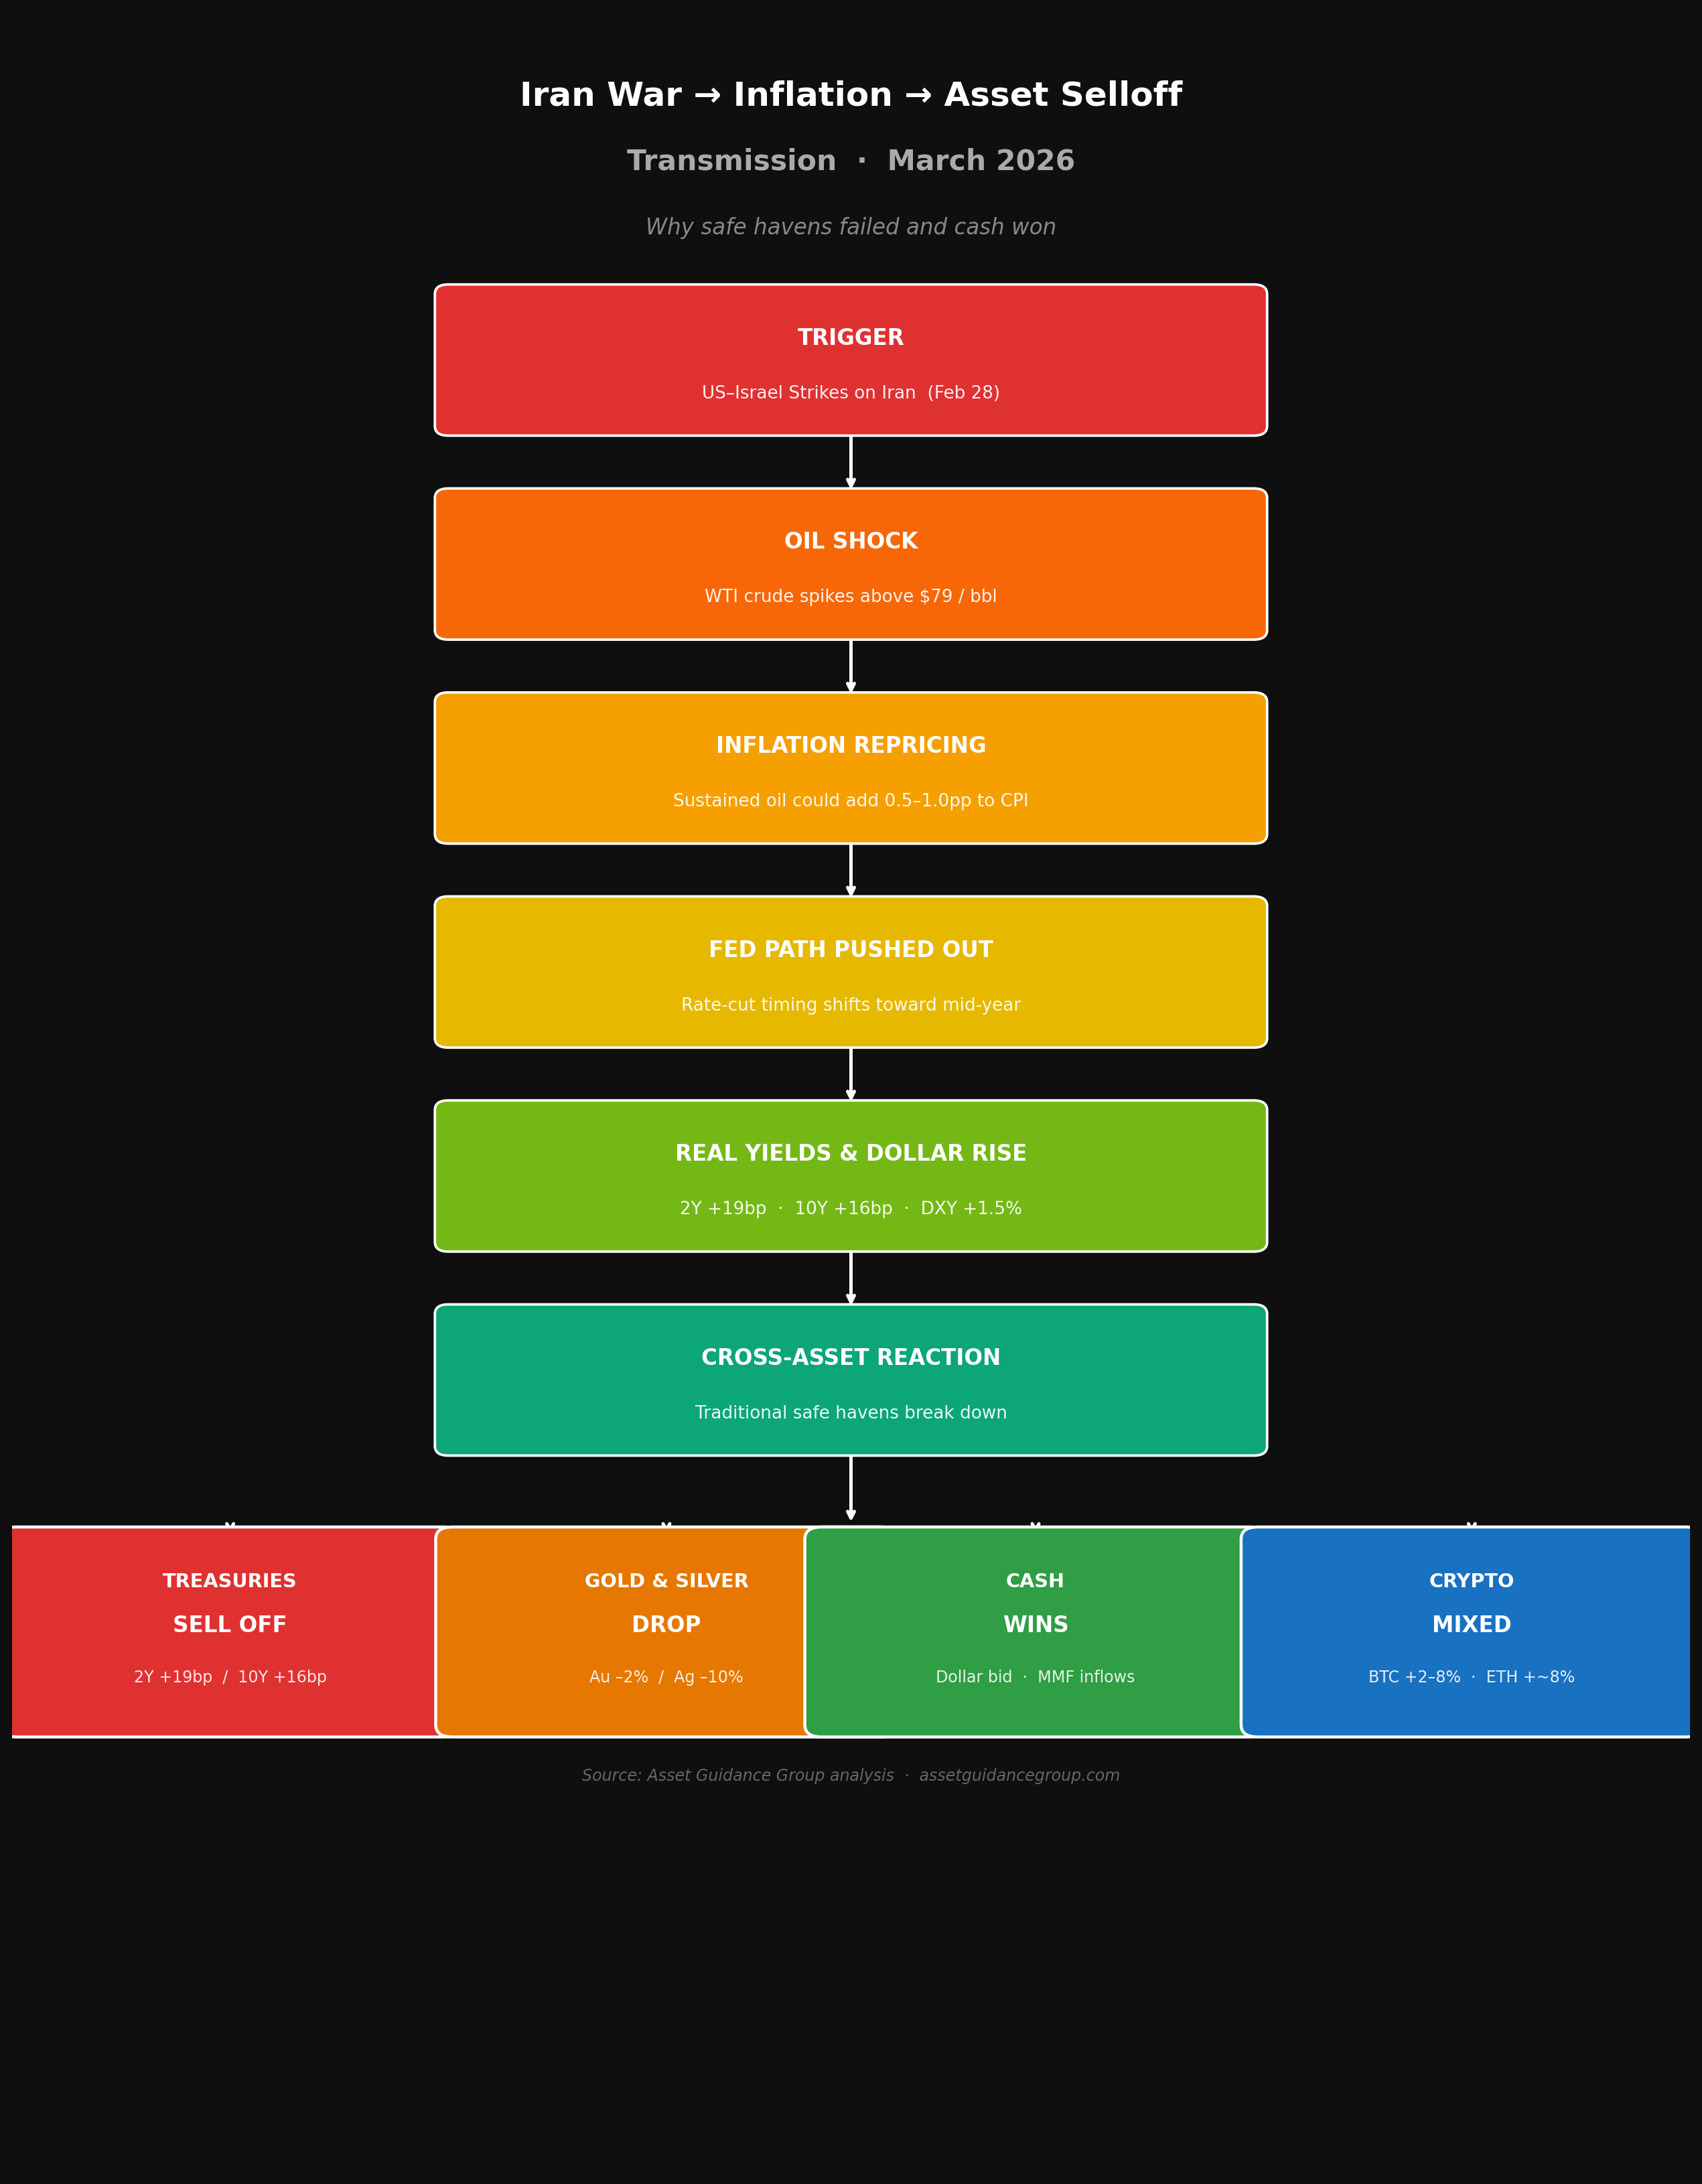
Shock #1: Iran. On February 28, U.S. and Israeli forces struck Iranian targets. Iran retaliated. The Strait of Hormuz — the chokepoint through which roughly 20% of global oil flows — suddenly looked vulnerable. Oil prices spiked. WTI crude moved above $79 per barrel, its highest level in months. Energy markets started pricing in genuine disruption risk, not just geopolitical noise.
Shock #2: Jobs. At 8:30 AM on Friday, March 6, the February jobs report landed. Economists expected the U.S. economy to add around 50,000 jobs. Instead, the number came in at -92,000. That's not a miss. That's a 142,000-job swing to the downside. In one number, the economic picture changed.
Inflation risk from one direction. Recession risk from the other.
That combination set the stage for something most investors rarely see — and almost never see coming.
When Safe Havens Stop Being Safe
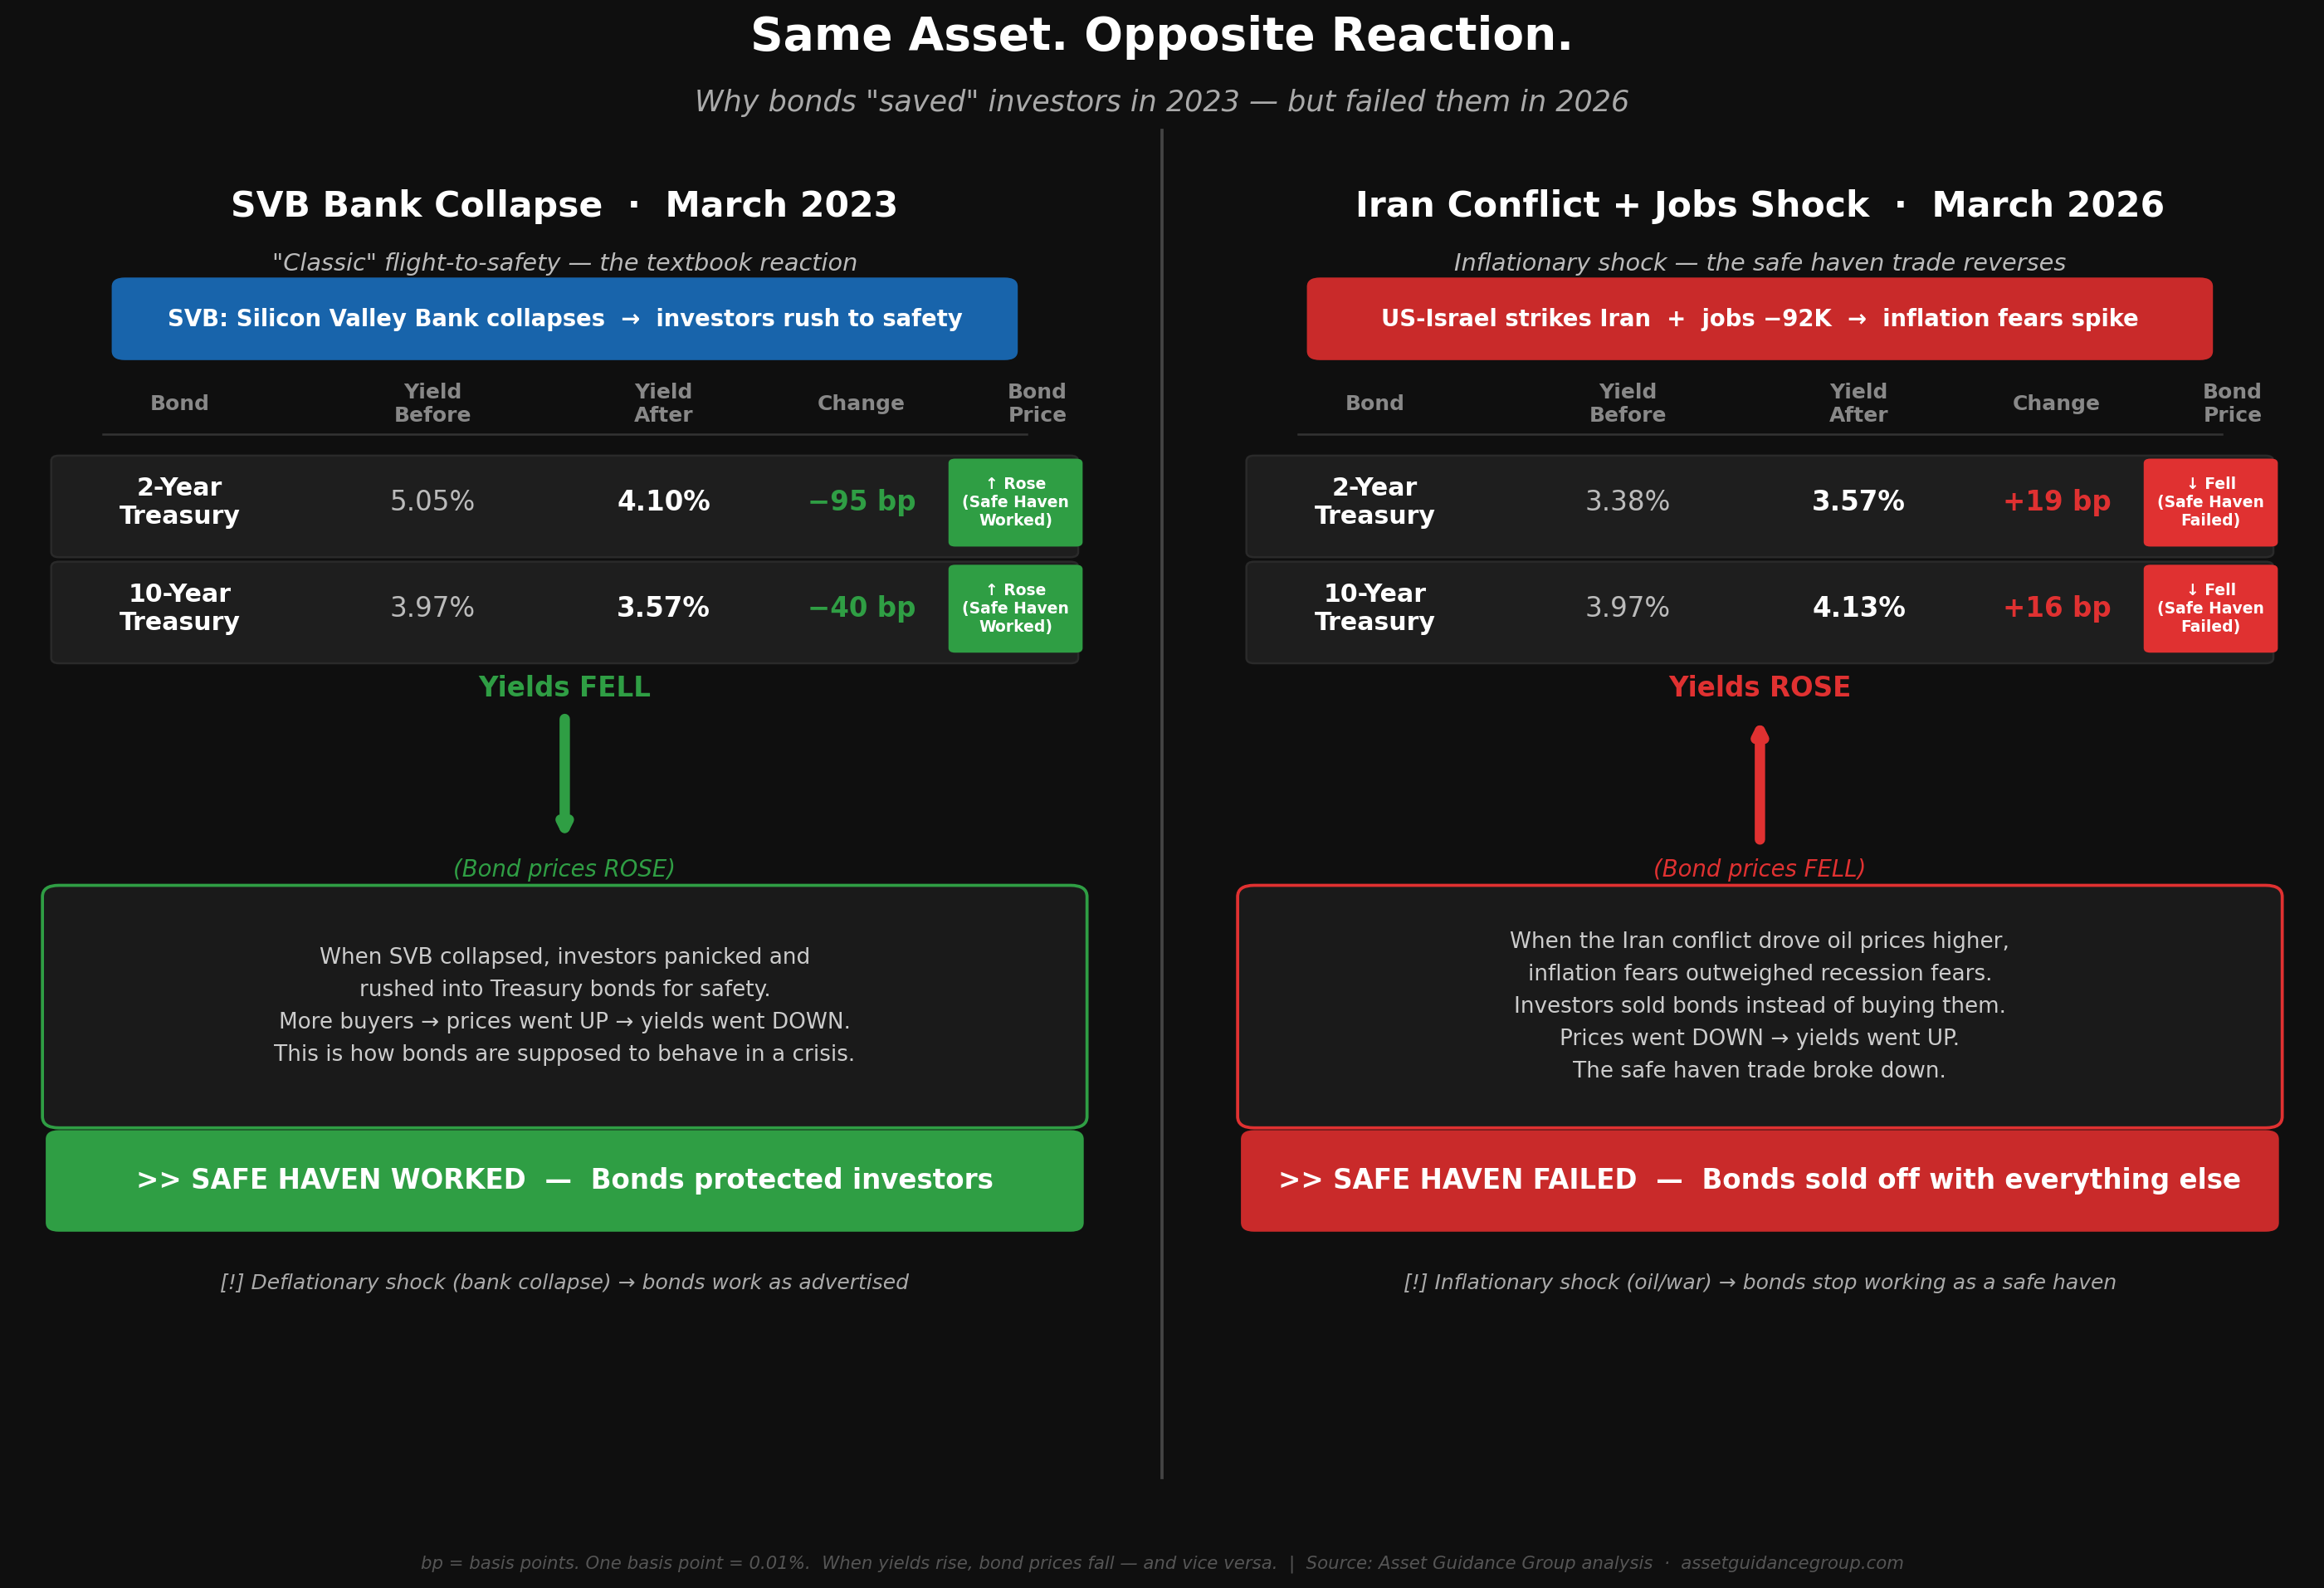
Here's what the textbook says should happen when war breaks out and economic data turns ugly: investors sell stocks and buy bonds, gold, and cash. Prices for "safe" assets go up. Yields on Treasury bonds go down as people rush in. A yield is simply the interest rate a bond pays — when demand rises, yields fall and prices go up.
That is not what happened.
This is exactly why managing a portfolio by the textbook alone is dangerous. The textbook was written for average conditions. It describes how markets usually behave. But markets don't care about averages during a crisis — they care about the dominant risk of this specific moment.
Bonds sold off. The 2-year Treasury yield rose 19 basis points this week, from 3.38% to 3.57%. The 10-year moved from 3.97% to 4.13%, up 16 basis points. Bond prices move in the opposite direction of yields — so rising yields mean falling prices. Investors who expected bonds to act as a shock absorber this week watched them bleed instead. Morningstar noted this was the biggest three-day jump in the 2-year Treasury since mid-2025.
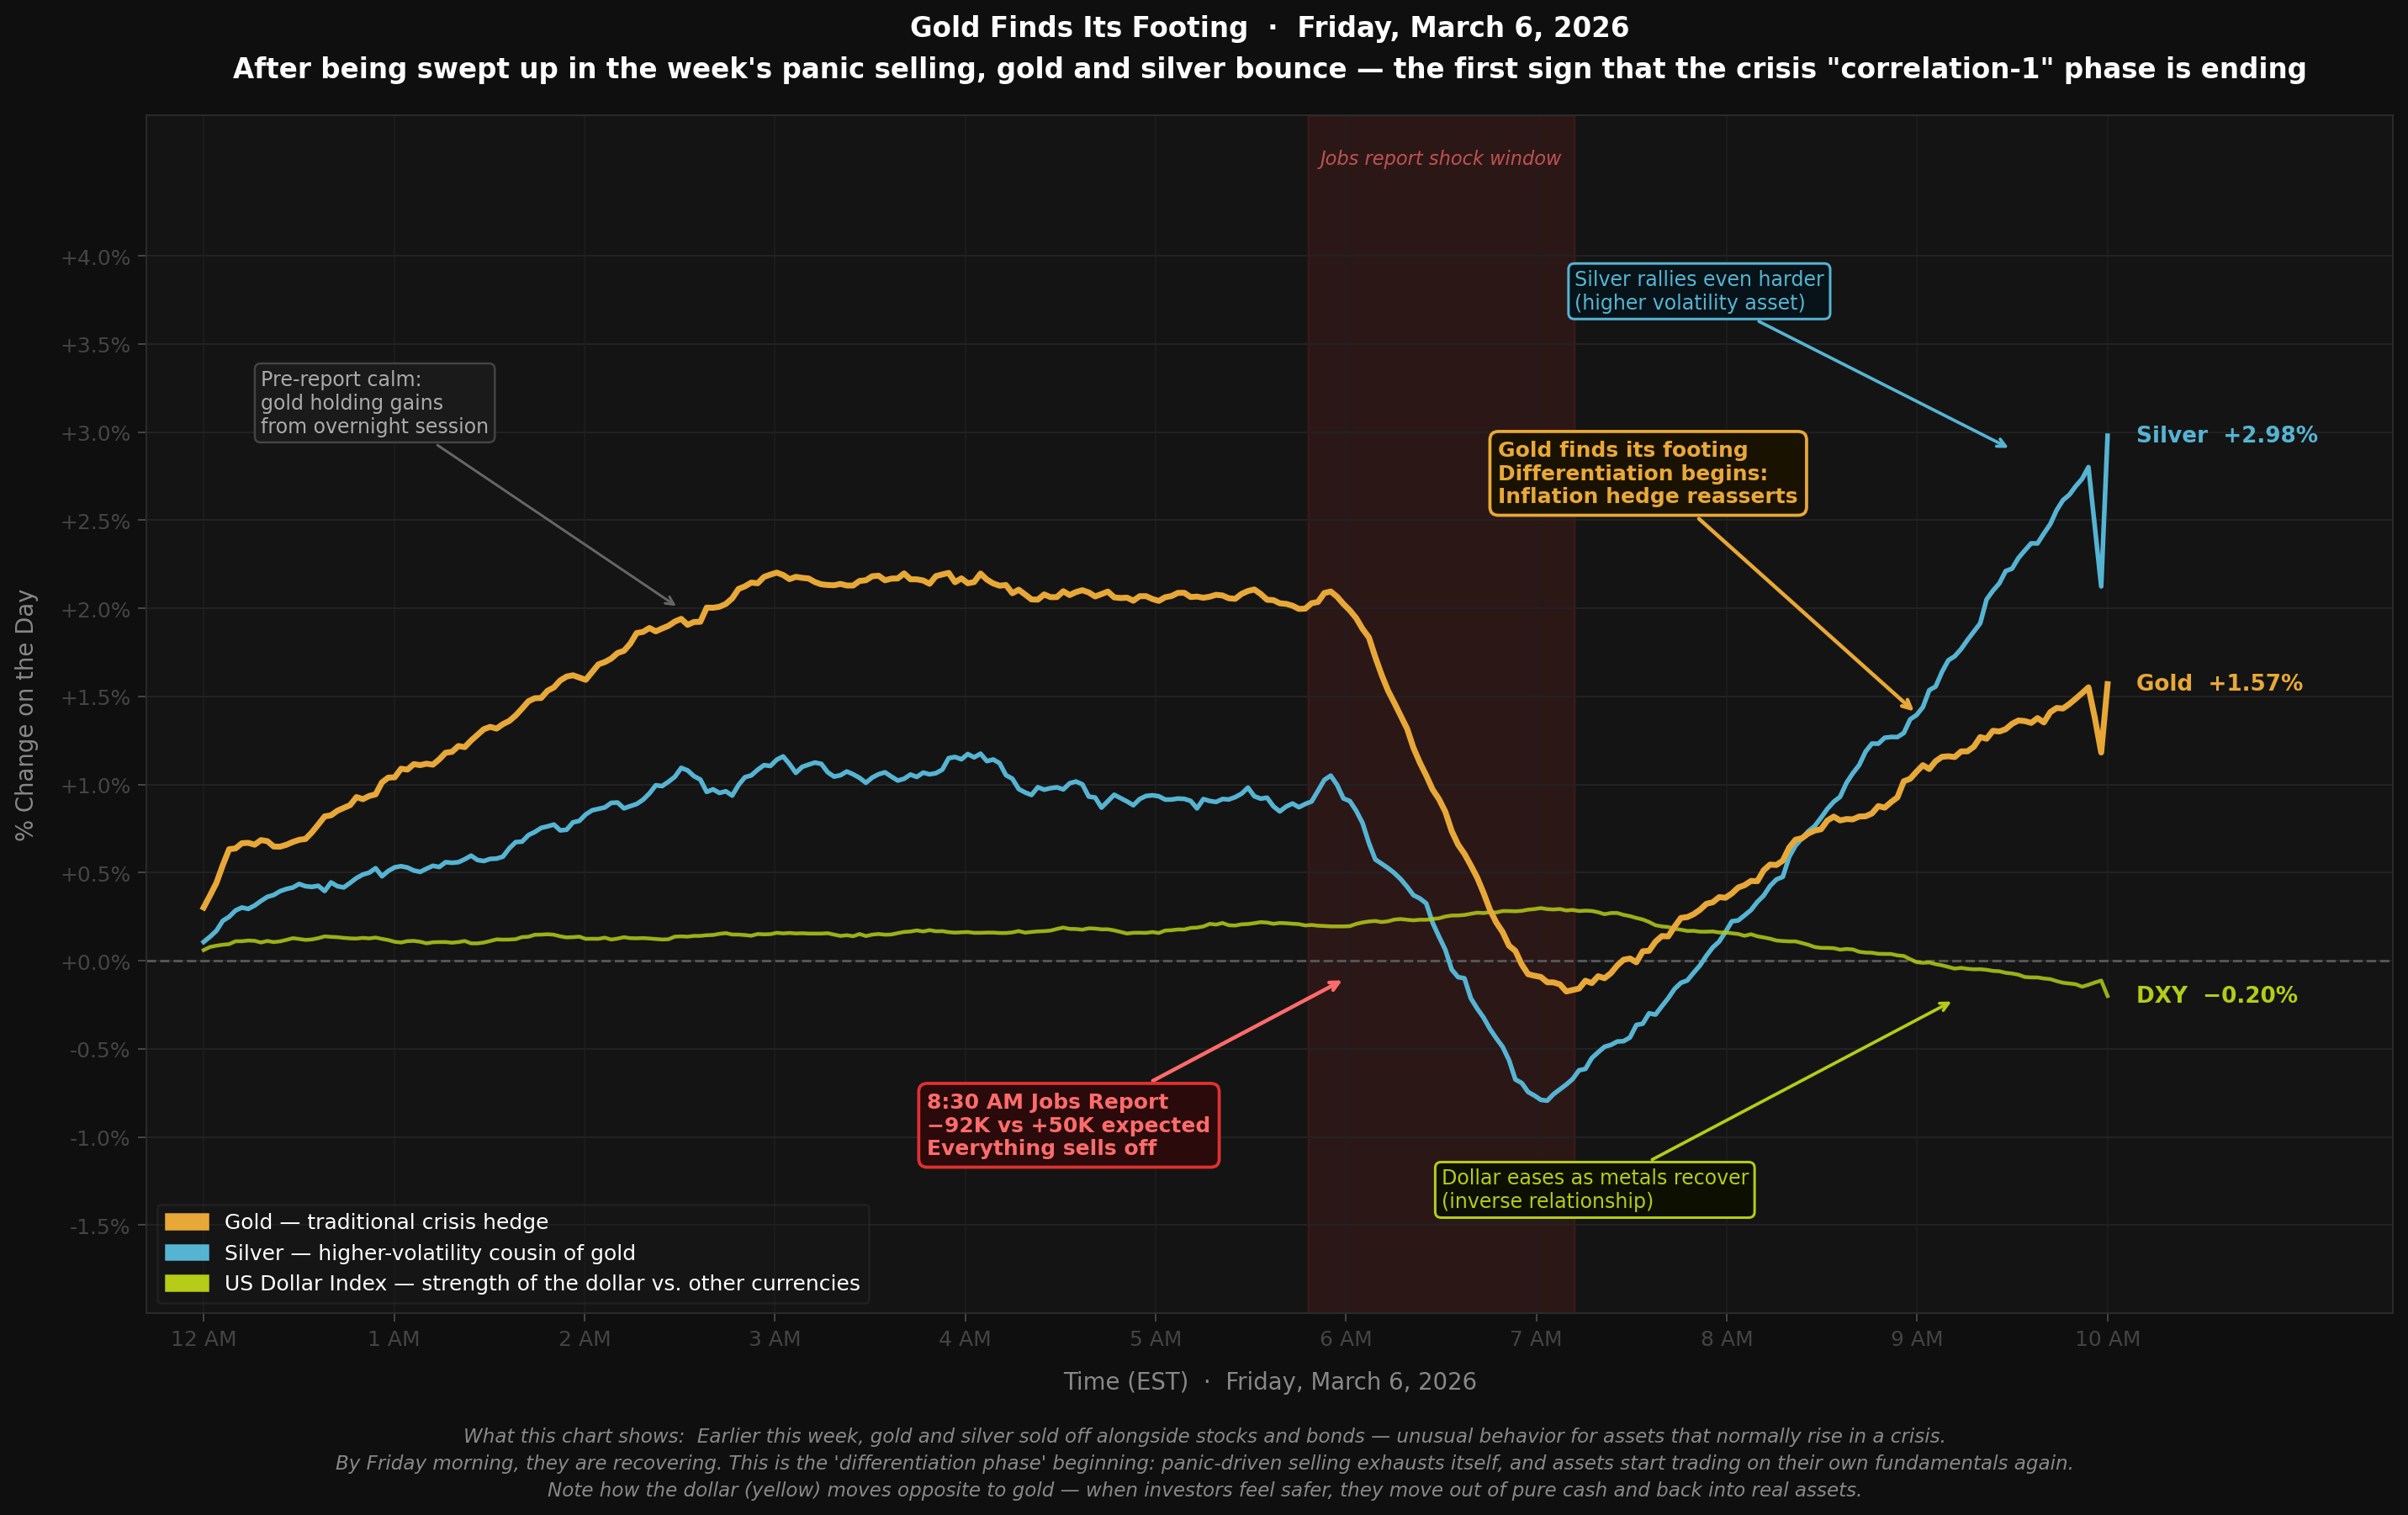
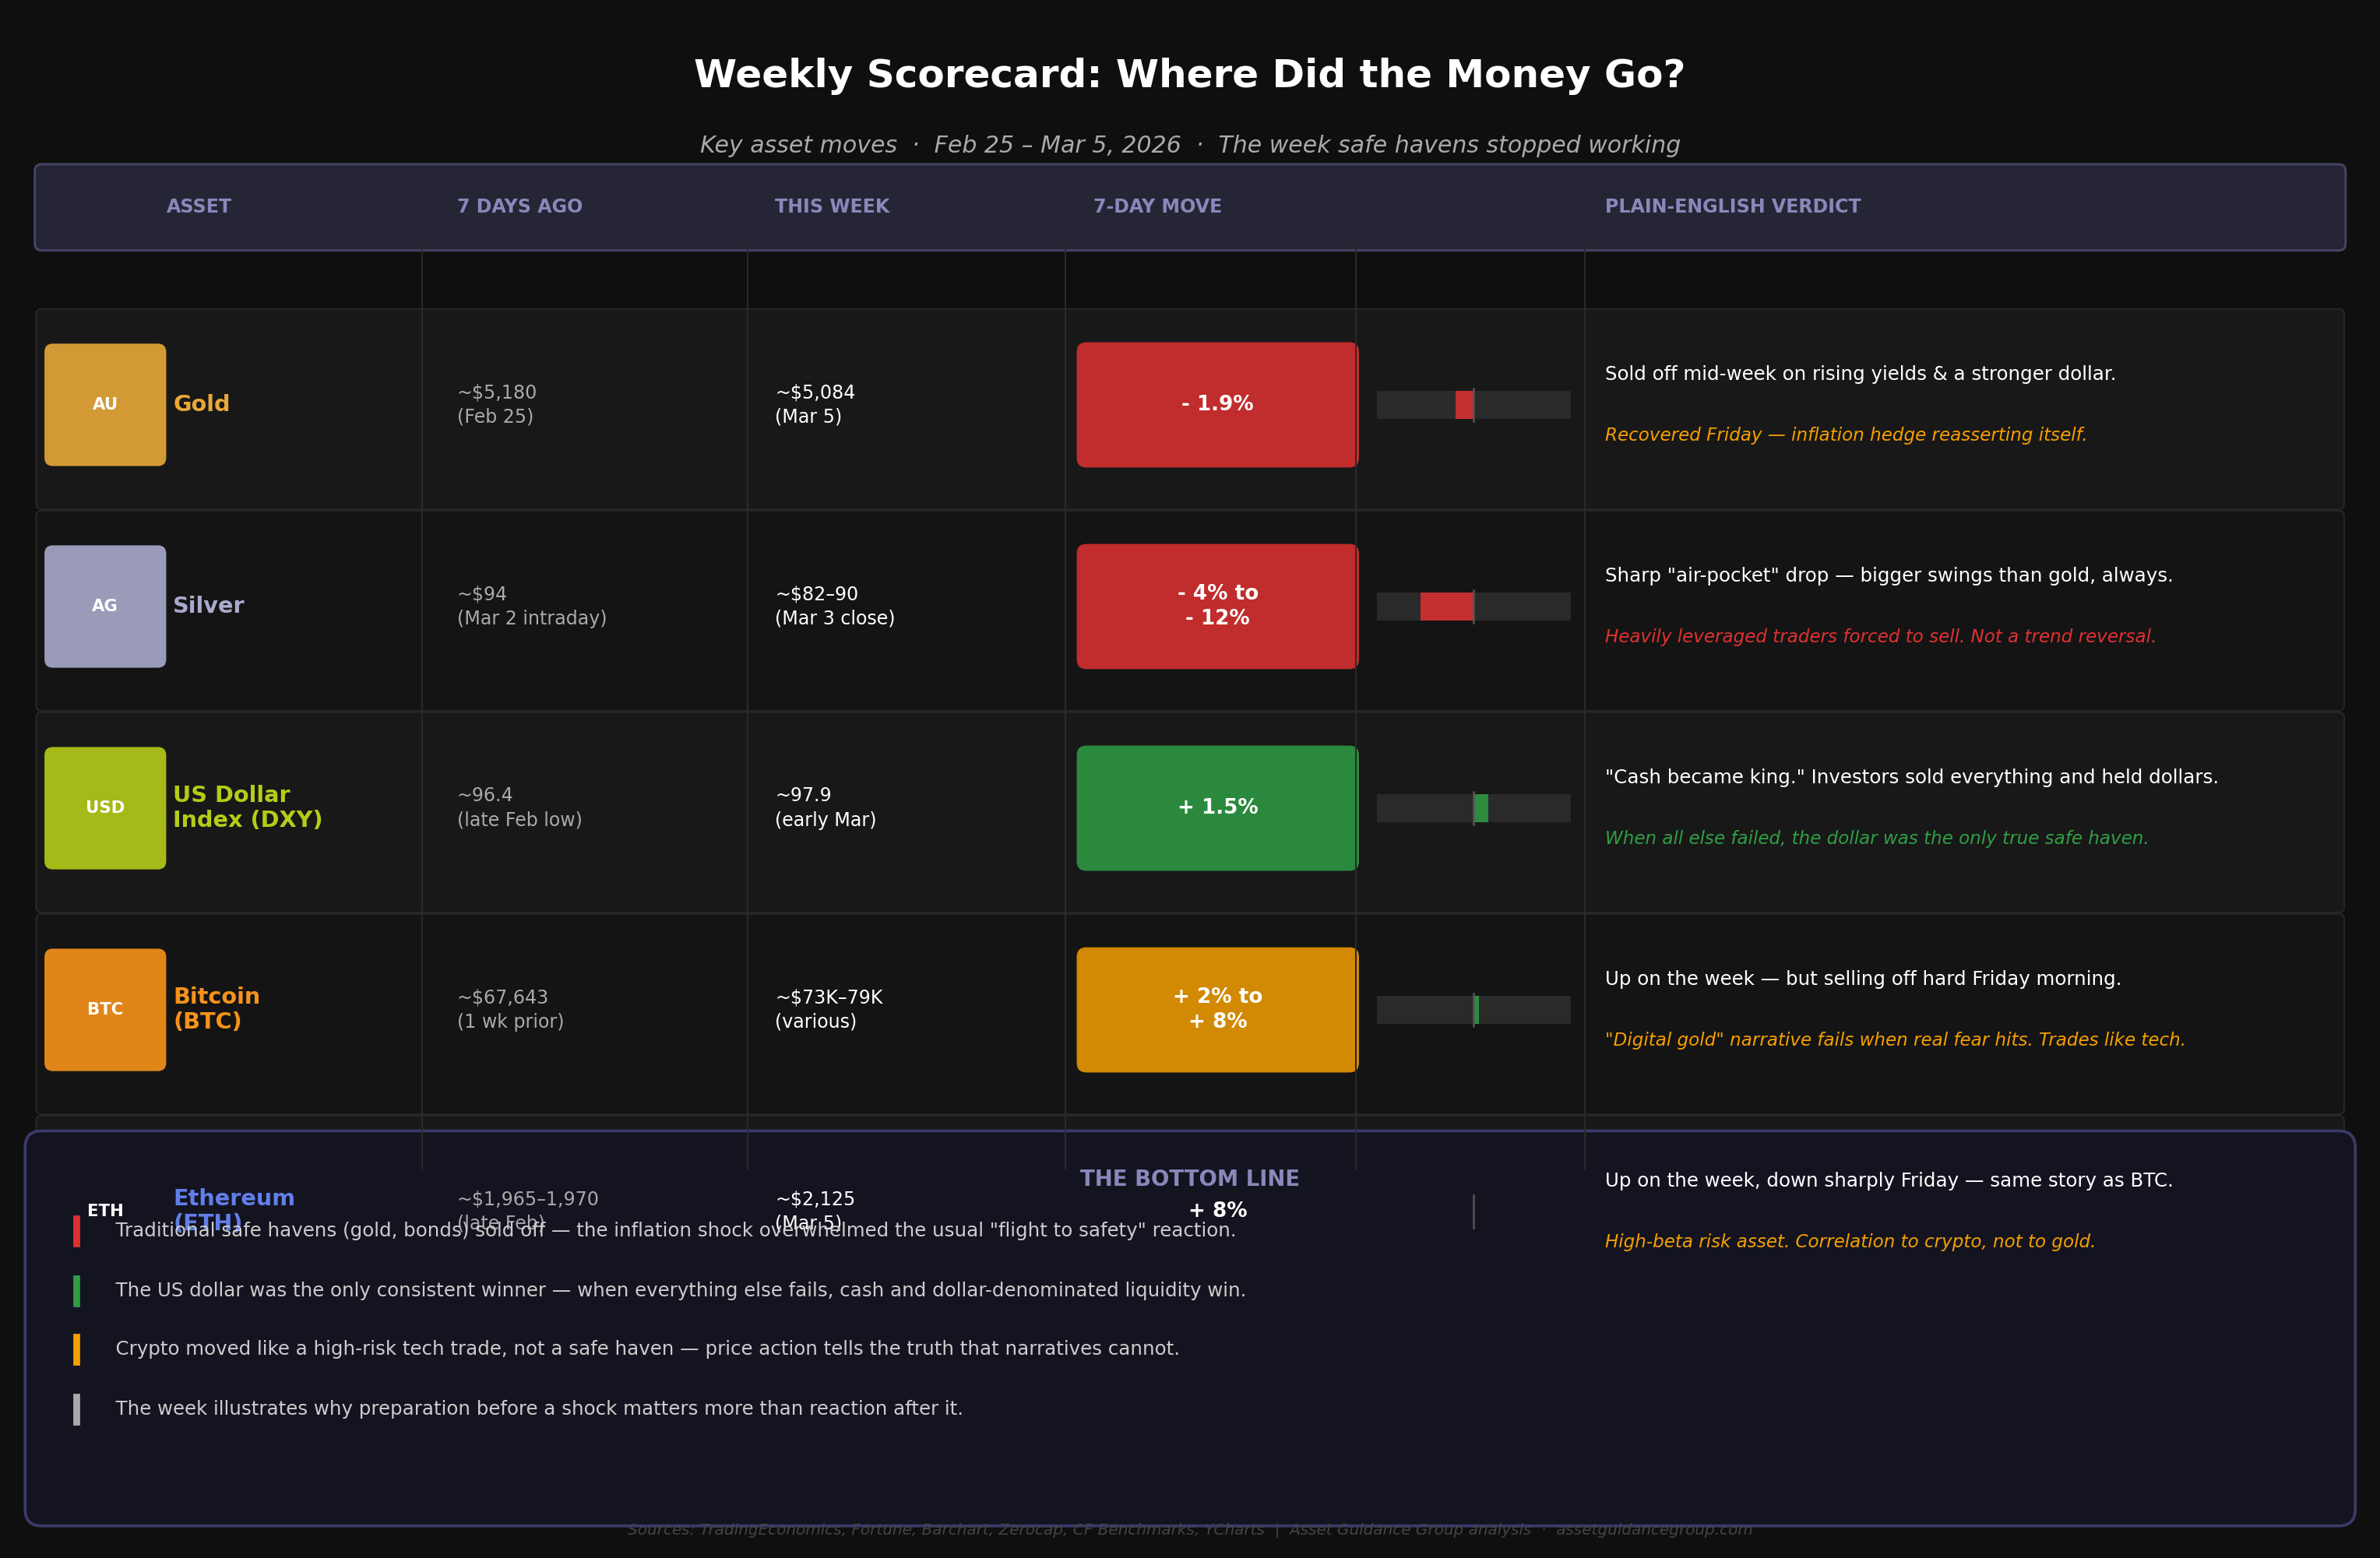
Gold stumbled — then bounced. Gold had been on a historic run, touching record highs above $5,200 per ounce in February. This week it pulled back toward $5,084 — down roughly 1.9% from levels seen just a week earlier. Silver was hit harder, dropping as much as 10-12% in a single session before stabilizing. By Friday morning, gold was recovering — up 1.46% on the day — a signal that the initial panic-driven selling was giving way to more rational price discovery.
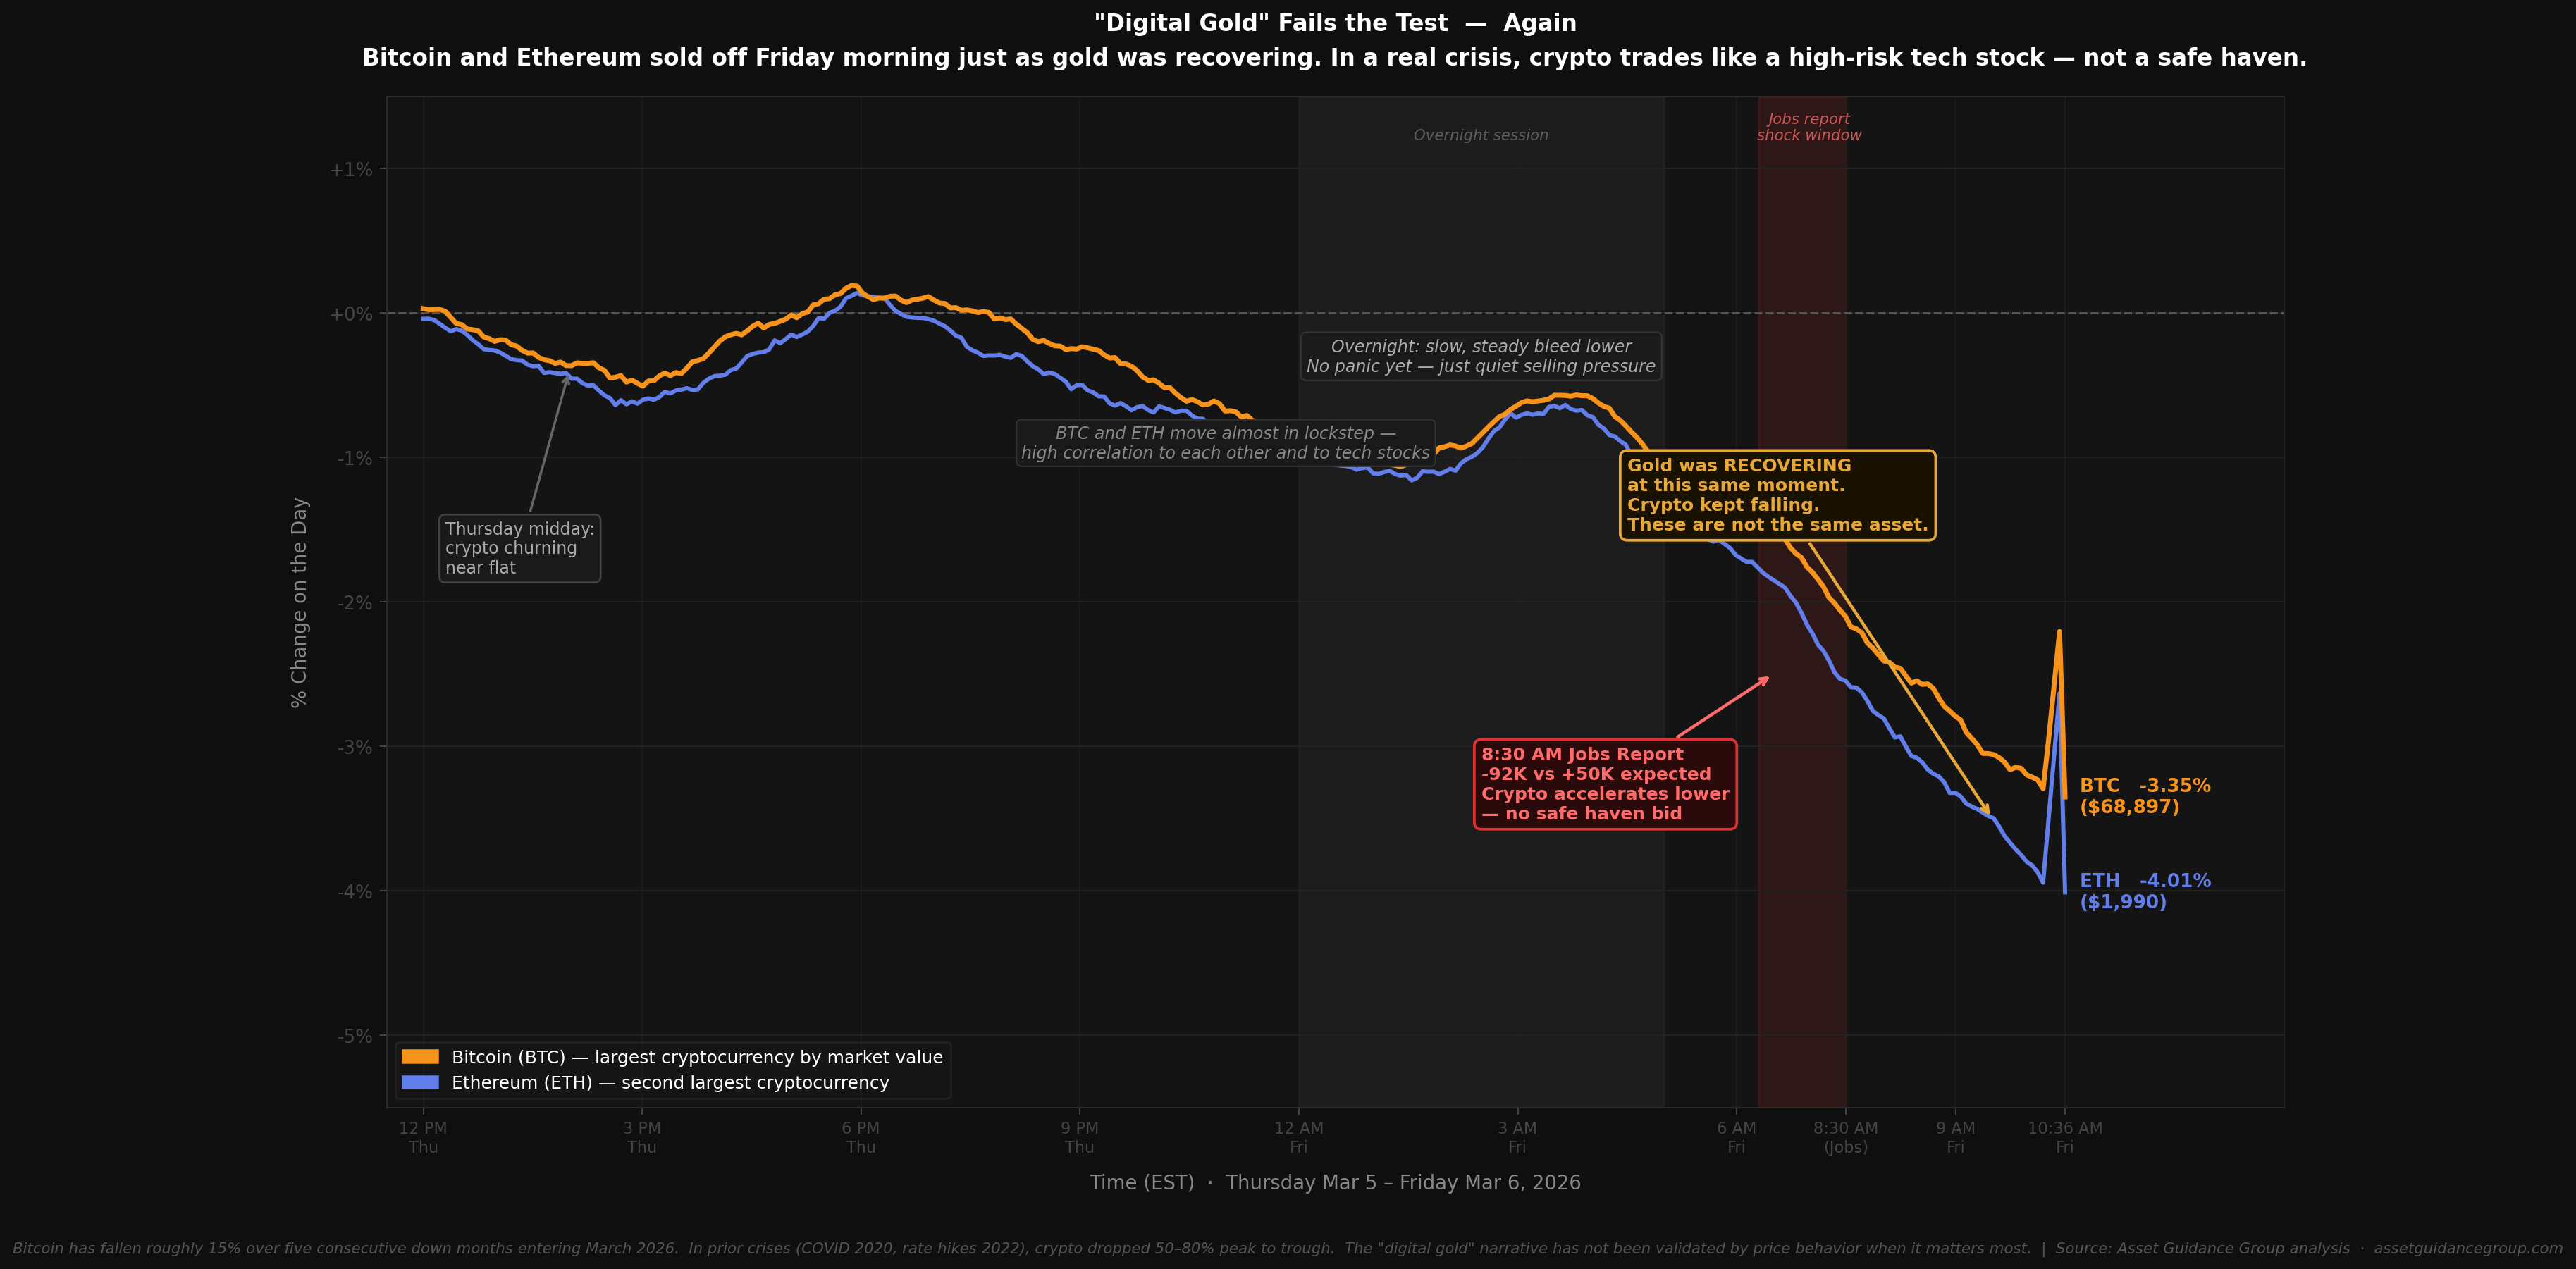
Bitcoin didn't save anyone. Despite years of "digital gold" marketing, Bitcoin and Ethereum both continued selling off Friday morning — down 3.35% and 4.01% respectively at the time of writing — even as gold was bouncing. When real fear hits, crypto tends to trade like a leveraged risk asset, not a crisis hedge. Price action tells the truth that narratives can't always support.
So where did all the money go? Into the dollar. Into very short-duration instruments. The dollar index actually rose about 1.5% on the week. In a week of crisis, the most liquid, shortest-duration holding was the only thing that held its value.
The Inflation vs. Recession Tug-of-War
To understand why bonds failed as a safe haven, you need to understand the tug-of-war happening inside the bond market.
When an economy slows, the Federal Reserve typically cuts interest rates. Lower expected rates are good for bonds — prices rise. That's the flight to safety bond investors count on.
But here's the problem: oil was going up. An energy shock is inflationary — it raises costs across the entire economy. And inflation is the enemy of bonds. If inflation stays high, the Fed can't cut rates. Or worse, it might have to raise them.
Bond investors were caught between two signals pointing in opposite directions. Recession said "cut rates." Oil-driven inflation said "hold rates higher." The inflation fear won. Bonds sold off.
The same logic hit gold. Gold tends to shine when real interest rates are low or falling — that's historically its sweet spot. But when real yields rise and the dollar strengthens, gold becomes less attractive compared to assets that earn interest. Add in margin calls — investors being forced to sell quickly to cover losses elsewhere — and you get a sharp, disorderly drop. The MOVE Index, which measures volatility specifically in the Treasury market, spiked to its highest reading of the year. The bond market's own fear gauge was flashing red.
The Correlation-1 Phase
There's a concept that comes up in serious risk management discussions, and this week demonstrated it perfectly.
In normal markets, different assets zig and zag. When one falls, another rises. That balance is what makes diversification work — you spread across assets that don't move together, so no single shock wipes everything out at once.
But in the first 48-72 hours of a genuine crisis, something strange happens. Everything falls together. Correlations collapse to 1 — meaning assets that normally move independently start moving in the same direction: down.
This happens because investors aren't making calm, rational adjustments. They're raising cash. Fast. Whatever they own, they're selling. Margin calls don't ask politely. Risk managers hit sell buttons. The result is that bonds, gold, equities, and perceived safe havens all get swept up in the same liquidation wave.
We saw this in March 2020, when COVID first hit. Stocks, bonds, gold, and even Treasuries briefly sold off together as investors scrambled for cash. The Fed had to intervene aggressively to stabilize things. We saw it again in 2022, when both stocks and bonds fell simultaneously as the Fed began its fastest rate-hiking cycle in decades — upending a 40-year assumption that bonds always protect a portfolio when stocks fall.
This week had the same fingerprints.
What Actually Works
So if the textbook safe haven playbook breaks in these moments, what does work?
Preparation, not reaction. By the time you see the headlines, the efficient trade has already happened. Markets move in minutes. The investors who navigate these weeks best aren't the ones who responded fastest on Friday morning — they're the ones who had already made adjustments when the risk picture was quietly shifting.
Statistical process, not textbook instinct. There's a meaningful difference between a system that follows conventional wisdom and one that has been tested against 8 to 18 years of actual market data across multiple economic regimes. Conventional wisdom says bonds protect you in a crisis. History says: it depends on the crisis. A rigorous, backtested process doesn't react to spikes or headlines — it responds to statistically demonstrated shifts in market conditions that meet specific, demanding criteria built from that historical record.
Process over prediction. No one predicted the exact combination of an Iran conflict and a -92,000 jobs print landing in the same week. No system needs to. What a disciplined process needs to do is recognize when the risk environment has shifted — before the crowd does — and position accordingly.
A confession most advisors won't make:
Twenty years of experience — and I've deliberately built a system that overrules my own instincts when the data says otherwise.
Here is perhaps the most important thing I can tell you about how this process works: I don't trust myself. Not when it comes to portfolio positioning. Twenty years of experience, an MBA, a law degree, a CFP designation — and I have deliberately built a system that overrules my own instincts when the data says otherwise. When my gut tells me to hold and the backtested evidence says move, I move. When my emotions say the market feels fine and the statistical signals say it isn't, I listen to the signals. The entire point of a rigorously validated, data-driven process is to remove the most dangerous variable in investing — human emotion, including my own.
The client who called me frustrated on Monday understood this by Friday afternoon. The move that felt overly cautious a week ago felt like exactly the right call by the close of markets.
What Comes Next
Here's the part that should feel reassuring if you've been defensive.
The correlation-1 phase doesn't last forever. At some point the indiscriminate selling exhausts itself and markets begin to differentiate — separating what was genuinely damaged from what was caught in the crossfire.
That differentiation phase is where preparation pays off. Investors who entered the crisis with a disciplined posture have choices. Those who were caught flat-footed are still managing the damage.
Knowing when that phase has arrived — and how to navigate it — is exactly the kind of judgment that a professional process is built for.
The historical pattern after March 2020's correlation-1 phase? A swift and powerful recovery in assets that had been indiscriminately sold. The investors who survived the panic intact — rather than making forced decisions at the worst prices — captured that recovery.
That's the real argument for disciplined, process-driven management. Not that you avoid every bad week. But that you enter the differentiation phase with options. With capital. With the ability to make decisions from strength rather than desperation.
The safe havens didn't disappear this week. They just required more preparation than most investors had in place.
Want to see how a systematic approach navigates weeks like this one?
Asset Guidance Group’s investment process is built around rules-based risk management — designed to respond to changing market conditions before headlines force everyone else’s hand.
Most advisors say 'trust me.' I've built something I trust more than myself — and that's exactly why you should trust it. And me.
Learn more about our approach →
Want to talk about how your portfolio is positioned? Reach out at [email protected] or book a time at assetguidancegroup.com/calendar.
Wallace R. Nichols, MBA, JD, CFP® is the Chief Investment Officer of Asset Guidance Group, LLC, a registered investment advisor. This article is for educational and commentary purposes only and does not constitute investment advice. Past performance is not indicative of future results. All investment strategies carry risk of loss.
Want to talk about how your portfolio is positioned? Reach out at [email protected] or book a time at assetguidancegroup.com/calendar