You Already Own This Trade
The most concentrated bet in your retirement account is one you never placed.
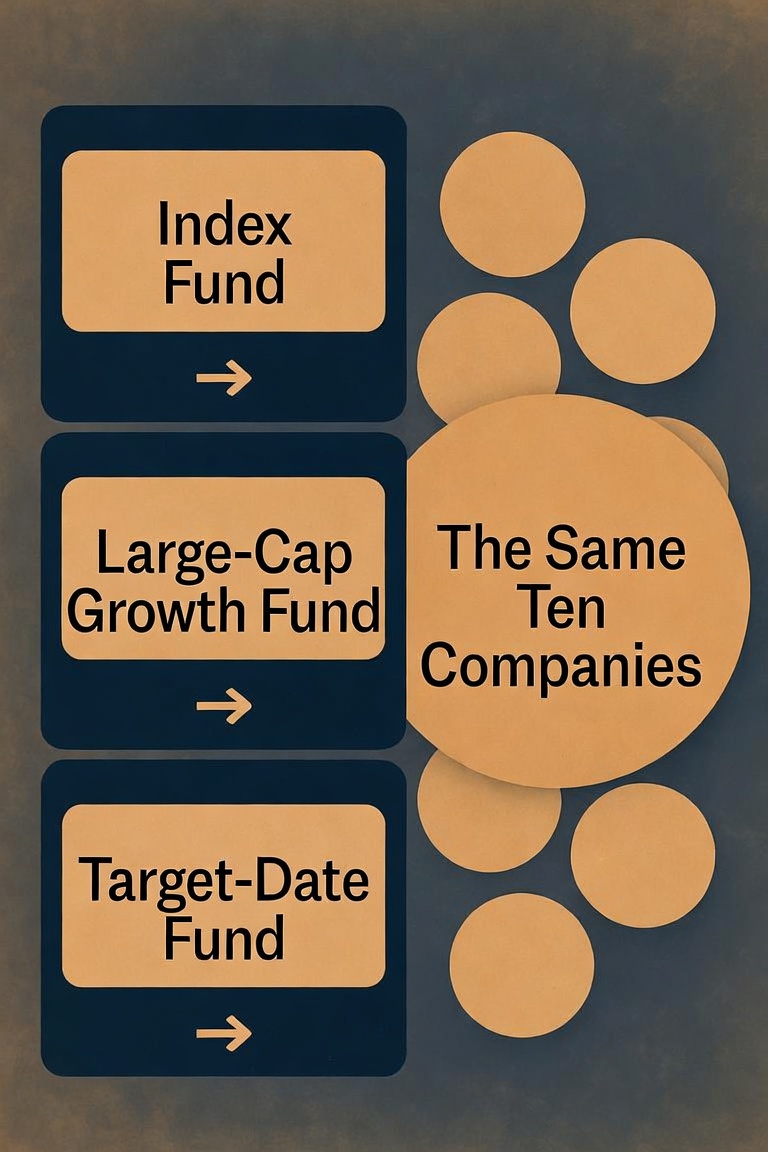
Most people in the ten years before retirement have done the responsible thing. They own a low-cost index fund. Maybe a large-cap growth fund alongside it. Probably a target-date fund in the old 401(k) from two jobs ago. Three different funds, from three different companies, bought at three different times. That feels like diversification.
For much of the last two years, it has not been.
This summer gave us a clean look at why. Between late June and late July, one corner of the market fell hard while the rest of it did fine. The people who got hurt were not, for the most part, people who had decided to make a risky bet. They were people who owned that bet three times over and did not know it.
That is what I want to walk through today — not whether you should buy something, but what you may already own.
The Trade Nobody Chose
A Word You Need for the Next Ten Minutes
The word is momentum. In investing, momentum means buying what has gone up recently, on the theory that it keeps going up for a while. It is one of the oldest patterns in markets, and there are funds built specifically to do it.
Here is the part that matters for you. You do not have to buy a momentum fund to own momentum. A fund that weights companies by their size automatically owns more of whatever has gone up the most, because going up is what made those companies big. The weighting does the buying for you. Nobody decides anything. It just happens, quietly, every day, inside a fund that has the word "index" on the label.
What That Looks Like Right Now
The ten largest companies in the S&P 500 account for roughly 38% of the entire index [S&P 500 top-ten holdings via SPY, 2026-08-04]. One company, NVIDIA, is somewhere near 8% by itself — more than the whole index's twelfth-largest through fiftieth-largest members combined [SPY holdings, 2026-08-04]. Information technology alone runs around 38% of the index [SPY sector weights, 2026-08-04].
So when you buy "the market," roughly two of every five dollars goes to ten companies, and a large share of those ten do closely related things.
Now add the large-cap growth fund. It holds the same names, weighted even more heavily. Add the target-date fund. Its equity sleeve is usually a broad index fund — the same names again. Three purchases, one position.
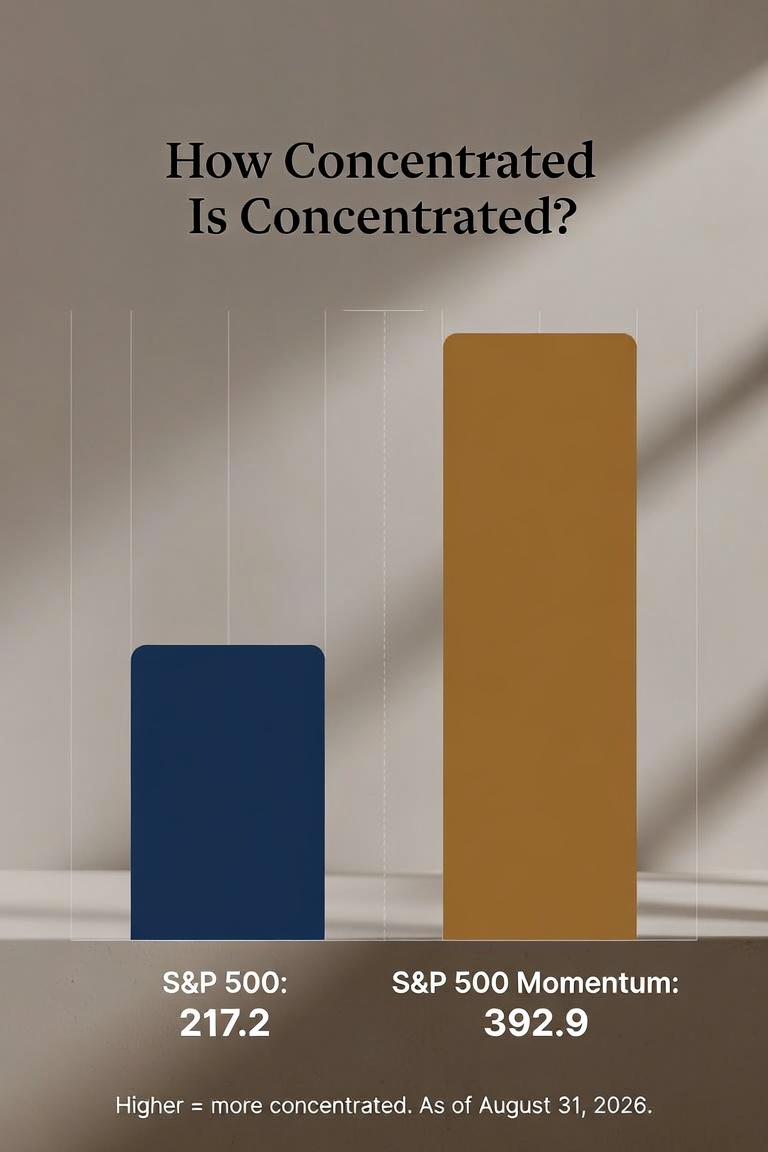
There is a measurement for this. Analysts use a concentration score to describe how much of an index sits in how few names. At the end of August, the S&P 500 Momentum Index scored 392.9 on that measure against the S&P 500's 217.2 [S&P Dow Jones Indices Factor Dashboard, 2026-08-31]. Higher means more concentrated. And the overlap is direct: that momentum index shared 44% of its holdings with the S&P 500 Growth Index and 36% with the S&P 500 itself [S&P DJI Factor Dashboard, 2026-08-31]. Its technology weight was 53% against a 38% benchmark [S&P DJI Factor Dashboard, 2026-08-31].
Read that again slowly. A specialized momentum strategy and a plain index fund were more than a third the same thing.
What Happened This Summer
Twenty-Six Days
On June 22, both the momentum trade and the semiconductor sector hit their highs for the year. On July 29, both hit their lows. Same peak day. Same trough day. The same twenty-six trading days in between [AGG internal analysis, Norgate total-return data, window 2026-01-02 through 2026-09-21].
Over that stretch, a widely held momentum fund fell about 18% from its high. The semiconductor sector fell about 29% [AGG internal analysis, Norgate total-return data, as of 2026-09-21]. Meanwhile the broad S&P 500 went up over roughly the same window, and the equal-weight version of the index — the one that holds the same 500 companies but gives each the same slice instead of weighting by size — went up too.
So this was not a market decline. The market was fine. One heavily crowded corner of it came apart.
The Diversification That Was Not There
Here is the finding that should change how you look at your own statement. If momentum exposure were a genuinely separate thing from semiconductor exposure, those two would not share an identical peak date, an identical trough date, and an identical twenty-six-day descent. They did. The momentum trade was not a diversified style at that moment. It was a bet on one industry wearing a different name.
That is the whole risk of owning something you did not choose. You cannot manage a position you do not know you hold. And the label on the fund will not tell you.
Same Days Underwater, Different Hole
One number from our own analysis stopped me. Through September 21, the momentum fund and the plain S&P 500 fund had spent exactly the same share of the year below their prior high — 83.2% of trading days, each [AGG internal analysis, Norgate total-return data, as of 2026-09-21].
Identical time underwater. But the momentum fund's worst decline was roughly twice as deep, and even after a strong rebound in recent sessions it remained about 10% below its June high while the S&P 500 fund sat under 2% below its own [AGG internal analysis, as of 2026-09-21].
Same amount of discomfort on the calendar. Very different amount of damage in the account.
Why It Broke
Everyone Owned It, and Some Owned It With Borrowed Money
Professional trading desks, leveraged funds, and individual traders had all crowded into the same names. When prices turned, risk limits at those firms forced selling — and the selling landed on the same handful of stocks, because that is what everyone held. Institutional strategists tracking this described it as a positioning unwind rather than a business problem. Company earnings outside the largest technology names were still growing through the period. This was about who owned what, and with how much borrowed money, not about a collapse in profits.
The Signal Is Slow on Purpose
Momentum strategies rank stocks on how they have performed over the past six to twelve months, and most rebalance only twice a year. That design means they buy last year's winners after the winning has happened, and they let go only after new leaders have already run. When leadership changes faster than the ranking updates, the strategy is holding yesterday's leaders into the turn. That is not a flaw anyone can fix. It is what the method is.
The Rate Backdrop Turned Against Long-Dated Growth
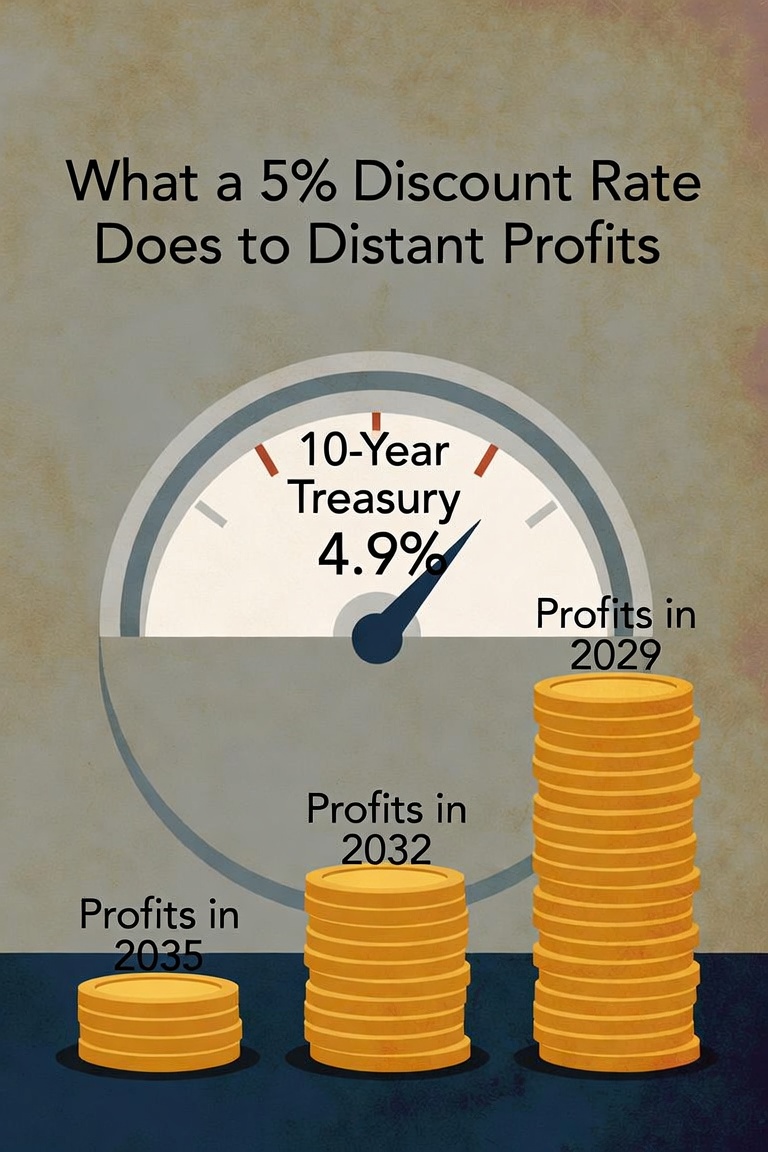
Fast-growing companies are valued mostly on profits expected far in the future. When the interest rate used to discount those future profits rises, the value of those distant profits falls — and it falls hardest for the companies whose profits are furthest out. That describes the largest technology names precisely.
Through the summer, inflation-adjusted Treasury yields climbed [FRED — DFII10, 2026-09-11: 2.60%]. Then on September 16, the Federal Reserve raised its benchmark rate by a quarter point, to a range of 3.75% to 4.00% — the first increase since 2023. The committee's own projections pointed to another increase before year-end [Federal Reserve, FOMC statement and Summary of Economic Projections, 2026-09-16].
What matters for your portfolio is the ten-year Treasury rate, which sits near 4.9% [U.S. Treasury yield curve, 2026-09-17]. That is the rate used to discount profits expected years from now, and it sets what those distant profits are worth today. The largest technology companies are valued almost entirely on earnings that arrive far in the future. When the ten-year is near 5%, those future dollars are worth measurably less than they were when it was near 4%.
A quarter point on its own changes very little. A ten-year rate near 5%, with the Fed signaling it is not finished, changes the arithmetic underneath exactly the companies your three funds are all concentrated in.
And Then It Bounced Hard
I want to be straight with you about something, because it is in the numbers above and you would find it anyway.
In the days right after the hike, these holdings rallied sharply — the momentum trade and the semiconductor sector both gained more in a handful of sessions than the broad market did, which is why the figures I just gave you are better than they were a week ago. That is not a contradiction of anything above. It is the same phenomenon viewed from the other side. A crowded, leveraged position does not only fall violently. It rises violently too, because the same forced flows run in reverse. On July 31, in the middle of the summer decline, the momentum trade posted its single largest daily gain in more than a year [MTUM +5.5%, 2026-07-31; largest single-day advance since April 2025].
That is what a crowded, leveraged position looks like from the inside. The volatility runs in both directions, which is precisely why you cannot manage it by watching the daily tape and reacting. You manage it by knowing how much of it you own before the swinging starts.
Why This Matters More in the Fragile Decade
Recovery Is Not Evenly Distributed
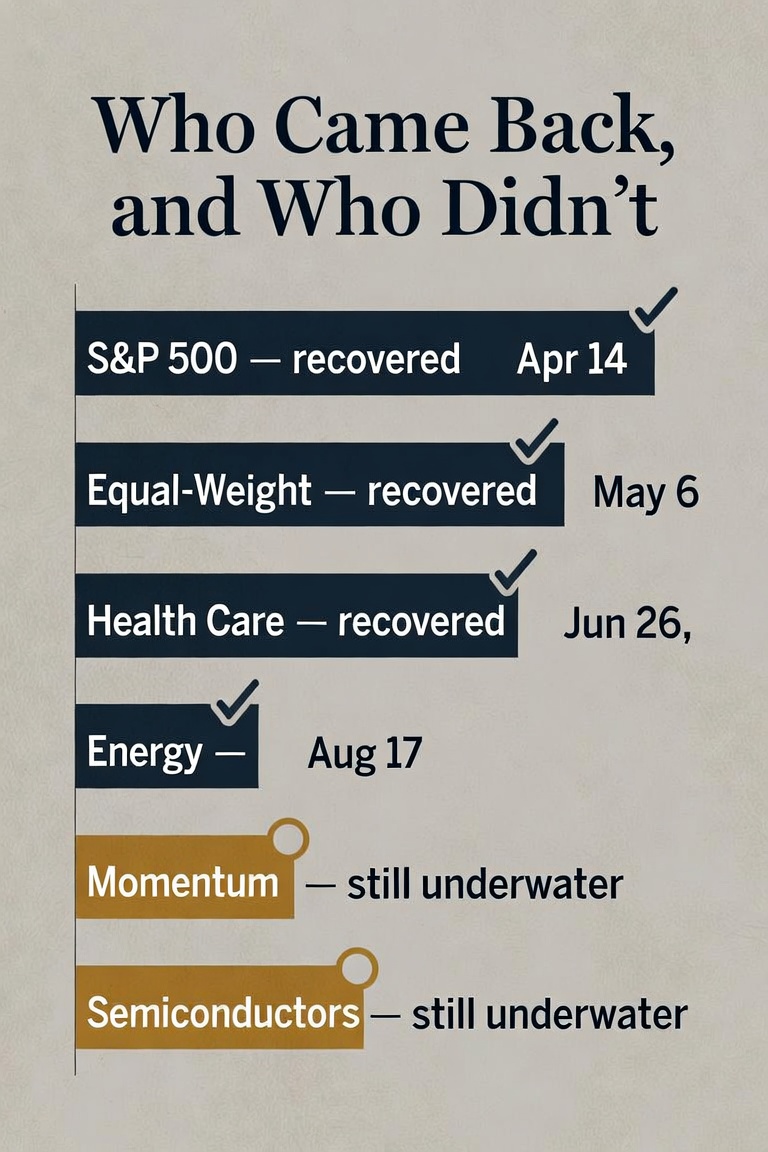
Look at what came back. The S&P 500 recovered its worst decline of the year by April 14. The equal-weight index by May 6. Health care by June 26. Energy by August 17. As of September 21, even after that rebound, the momentum trade and the semiconductor sector still had not recovered [AGG internal analysis, Norgate total-return data, as of 2026-09-21].
Five months later, one group of holdings is whole and another is not. If your portfolio leans toward the second group without your having decided that it should, you are carrying a recovery timeline you never agreed to.
When a Drawdown Is Serious, and When It Is Not
I want to be careful here, because this is the point most commentary gets wrong in both directions.
A decline in money you will not touch for years is survivable. Markets fall and recover, and an investor who does not have to sell gets to wait. A drawdown in a genuine risk-capital sleeve with no withdrawals coming out of it is not a crisis. It is the cost of being invested.
The problem is specific and narrower than "markets are scary." It is when you are taking money out while the account is down. Every dollar withdrawn from a portfolio in a drawdown is a dollar that is not there to recover — you have locked the loss in and permanently shrunk the base. That is the real risk in the years right before and right after you stop working, and it is why the same 18% decline means something completely different at 62 than it did at 42.
The uncomfortable part is that the people most exposed to this are usually the ones who thought they were being conservative. They bought the index fund. They did the responsible thing. Nobody told them that the responsible thing had quietly become a concentrated position in one industry.
What We Do About It
Knowing What You Own Is the Whole Job
The first work we do with a new client's portfolio is not to trade it. It is to look through every fund to what is actually underneath, and add it up. Most of the time, the concentration we find is not the one the client expected. Three funds that looked like three decisions turn out to be one.
That is a planning conversation before it is an investment conversation. It is also where having investment management, tax work, and estate planning under one roof does real work — because fixing a concentration problem inside a taxable account is a tax question as much as a market question, and the wrong sequence of trades can solve one problem while creating another.
Discipline Where It Is Hardest to Hold
For the retirement capital we manage, our automated system watches risk conditions across every trading day and adjusts positioning continuously as those conditions change. It is rules-based by design, because the moments when overriding the rules feels most justified are the moments when overriding them has historically cost the most. When the system's defensive criteria are met, it moves toward short-duration fixed income rather than sitting through the decline.
That continuous monitoring narrows exposure to severe drawdowns. It does not eliminate it — no system does — and we take every measure practicable to keep the math of recovery on the client's side.
The case is not that we know which industry leads next. Nobody does, and this summer punished a great many confident people who thought otherwise. The case is that retirement money deserves to be positioned on purpose. Every holding in it should be there because someone decided it should be, with a clear view of what it overlaps with and what happens to it when the thing it overlaps with falls 29% in twenty-six days.
You may already own this trade. The question worth answering this week is how many times.

Take Action
If this raised a question about your own accounts — particularly if you hold an index fund, a growth fund, and a target-date fund and have never looked at how much they overlap — that is exactly the kind of review worth doing before you need it rather than after. Reply to this email, call the office, or schedule a review here. You can also see how our defense-first investment system works at assetguidancegroup.com/ats-mgmt-landing-page-347034. For direct contact: [email protected].
───This post originally appeared on The Lighthouse on Substack — weekly financial analysis written specifically for people within ten years of retirement. Subscribe free at The Lighthouse on Substack or upgrade for weekly Trades of the Week picks.───
Investing involves risk, including the possible loss of principal. This article is for informational purposes only and does not constitute personalized investment advice. Past performance is not indicative of future results. References to specific indices, sectors, or funds are for illustrative and educational purposes only and do not constitute a recommendation to buy or sell any security. Index performance does not reflect the deduction of fees or expenses, and investors cannot invest directly in an index. Diversification does not ensure a profit or protect against loss in a declining market.
Wallace R Nichols, MBA, JD, CFP Chief Investment Officer Asset Guidance Group, LLC, a registered investment advisor