The Market Is Telling You Something. Here's How to Listen.
Four straight weeks of losses. Correction territory. A recession probability model crossing 50%. The Lighthouse has been pointing at this. Now let's talk about what to do with it.

Friday was ugly.
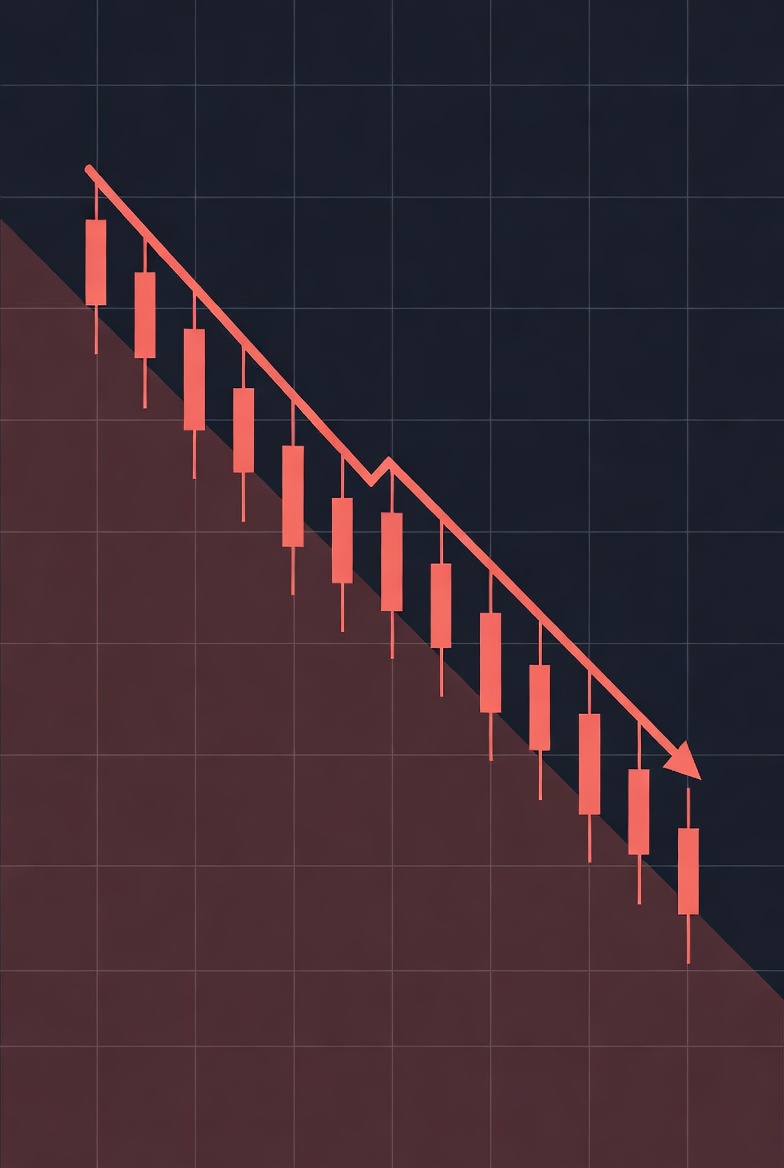
The S&P 500 dropped 1.51%, closing at 6,506. The Russell 2000 — the index that tracks smaller American companies — officially entered correction territory, meaning it has now fallen more than 10% from its recent high. The Nasdaq fell over 2%. The Dow shed 444 points. Oil closed near $112 a barrel after Iraq declared force majeure on its oil exports and drones struck refineries in Kuwait.
That's four consecutive weeks of losses for the S&P 500. The longest losing streak in approximately a year.
If you've been reading The Lighthouse, none of this should feel like it came out of nowhere. It didn't.
What Happened
Let me give you three numbers that tell the story.
49%. That's where a widely followed recession-probability model stood before the Iran conflict started. Moody's chief economist noted publicly this week that a reading above 50% has preceded every recession the model has ever flagged — and that it wouldn't take much to push it over that line. Oil above $100 for any sustained period tends to do exactly that.
39. That's the S&P 500's current CAPE ratio — a measure of how expensive stocks are relative to long-term earnings. Its historical average is closer to 17. The only other times in living memory it has been near 39 were the late 1920s and the dot-com bubble of 2000. That doesn't mean a crash is coming tomorrow. It means the market had almost no cushion to absorb bad news. And bad news arrived.
-10%. Gold — the asset that is supposed to protect you when everything else falls — dropped more than 10% in five trading days. Three weeks ago, in "When Everything Moves at Once," The Lighthouse described exactly this: a market environment where the old rules of diversification stop working. Stocks fall. Bonds fall. Gold falls. The correlations break. That is what is happening right now.
One more thing about Friday specifically: it was triple witching day — the simultaneous expiration of stock options, stock index futures, and stock index options. This happens four times a year and almost always generates outsized volume and volatility as traders close out positions. A down day on triple witching during an already-weak trend amplifies the move. It doesn't create it. The underlying weakness was already there. Friday just turned up the volume.
What It Means for Me
Here's what I want you to hold onto: a falling market is not the same as a broken retirement.
But — and this matters — it can become one if the timing is wrong.
This is the concept I've written about before under the name sequence-of-returns risk. The short version: a major loss at age 62 does far more damage than the same loss at age 35. At 35, you have decades to recover. At 62, you don't. If you're drawing income during that recovery, or if you're about to retire and need to start drawing income, the math gets brutal fast. A 50% loss requires a 100% gain just to get back to even. When withdrawals are happening at the same time, the recovery math gets even worse.
This is the environment we've been describing for three weeks. The Iran war. The oil shock. The broken safe-haven correlations. The Fed boxed in by stagflation risk. The hawkish hold last Wednesday. Each of those stories was a brick in the same wall. The wall is now visible.
What does it mean for you specifically?
If you are more than ten years from retirement and you have a long time horizon, a correction like this — uncomfortable as it feels — is part of the cycle. History is clear that every red arrow eventually became a buying opportunity. The Optimist's Track Record chart we published during the Citrini series shows this going back to 1950.
But if you are in the fragile decade — roughly ages 57 to 67, within ten years of retirement — this is not the time for passive reassurance. This is the time to know, specifically, what your plan does when the market falls. Not what it should do in theory. What it actually does.
Is your advisor watching? Is there a mechanism that responds to this? Or are you hoping the market finds its floor before you need to start drawing down?
Those are the questions that matter right now.
What We're Doing About It
I'll be direct. This is what the ATS was designed for.
Not this specific scenario — nobody predicted that Iran would close the Strait of Hormuz and push Brent crude to $112 — but this type of scenario. A market that's losing altitude across multiple weeks. Market loss signals that keep building instead of resolving. An environment where the usual shock absorbers aren't working. This is exactly the environment where a rules-based, continuously responsive system earns its keep.
Our approach doesn't try to predict what happens next. It monitors market signals throughout every trading day and adjusts positioning based on tested rules — not headlines, not gut feelings, not the same emotional impulses that lead most investors to hold too long and then sell at exactly the wrong moment.
I've built something I trust more than my own instincts. In more than 18 years of backtested data, that discipline has made the difference.
Defensive positioning right now is not pessimism about the future. The long-term case for the American economy — and for what AI and new technology will do for productivity and growth over the next decade — is still intact. The Lighthouse will return to that story soon. But you can only participate in the long-term recovery if you survive the short-term damage. That's the math. And the math is what we manage.
If the next few weeks bring more clarity — on Iran, on oil, on recession signals — we'll cover it. If things deteriorate further, we'll cover that too. The Lighthouse doesn't go quiet when the weather turns.
Before You Go
If this article raised questions about your own situation — whether your plan has a real mechanism for environments like this, or whether you're relying on hope and diversification — let's have that conversation. The time to check the rigging is before the storm gets worse, not after.
Learn more about how we manage portfolios in environments like this: assetguidancegroup.com/ats-mgmt-landing-page-347034
Or reach out directly: [email protected] | assetguidancegroup.com/calendar
───This post originally appeared on The Lighthouse on Substack — weekly financial analysis written specifically for people within ten years of retirement. Subscribe free at [The Lighthouse on Substack] or upgrade for weekly Trades of the Week picks.───
Investing involves risk, including the possible loss of principal. This article is for informational purposes only and does not constitute personalized investment advice. Past performance is not indicative of future results.
Wallace R Nichols, MBA, JD, CFP Chief Investment Officer Asset Guidance Group, LLC, a registered investment advisor