The Cost of Capital Just Reset — and Equities Haven't Fully Absorbed It
The Cost of Capital Just Reset — and Equities Haven't Fully Absorbed It
The risk-free rate moved. Every stock has to repay. (Part 2 of 2)
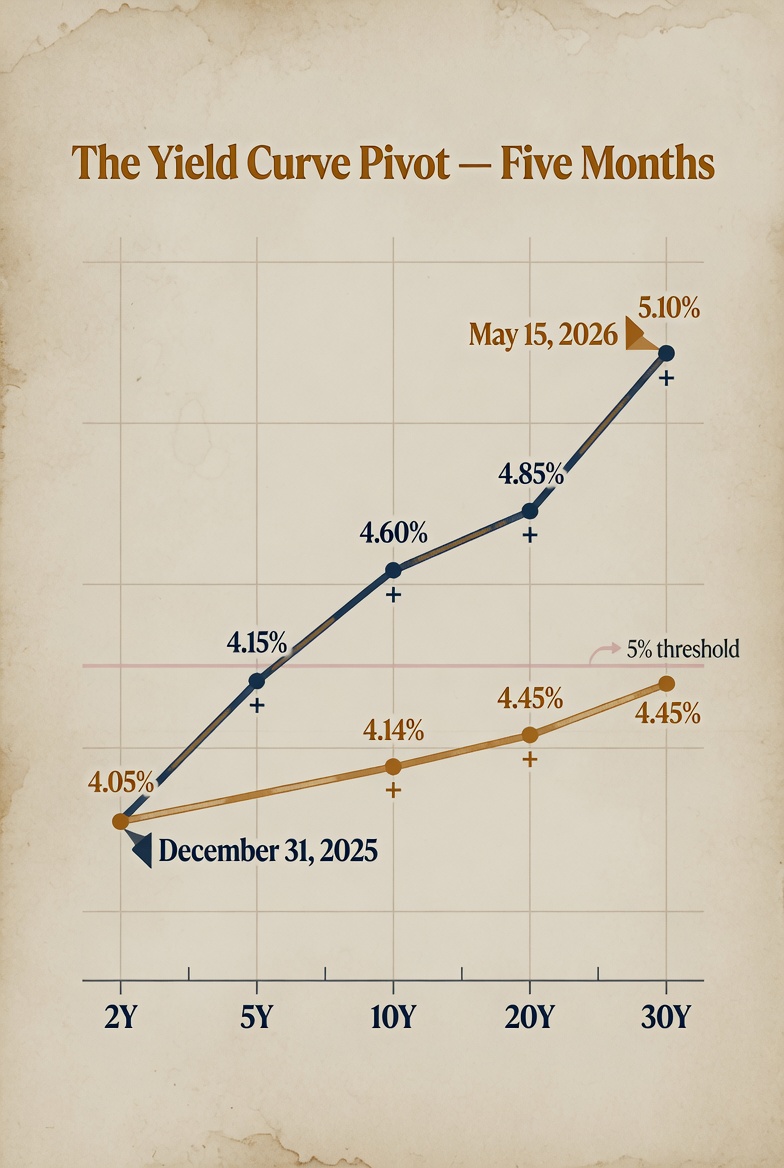
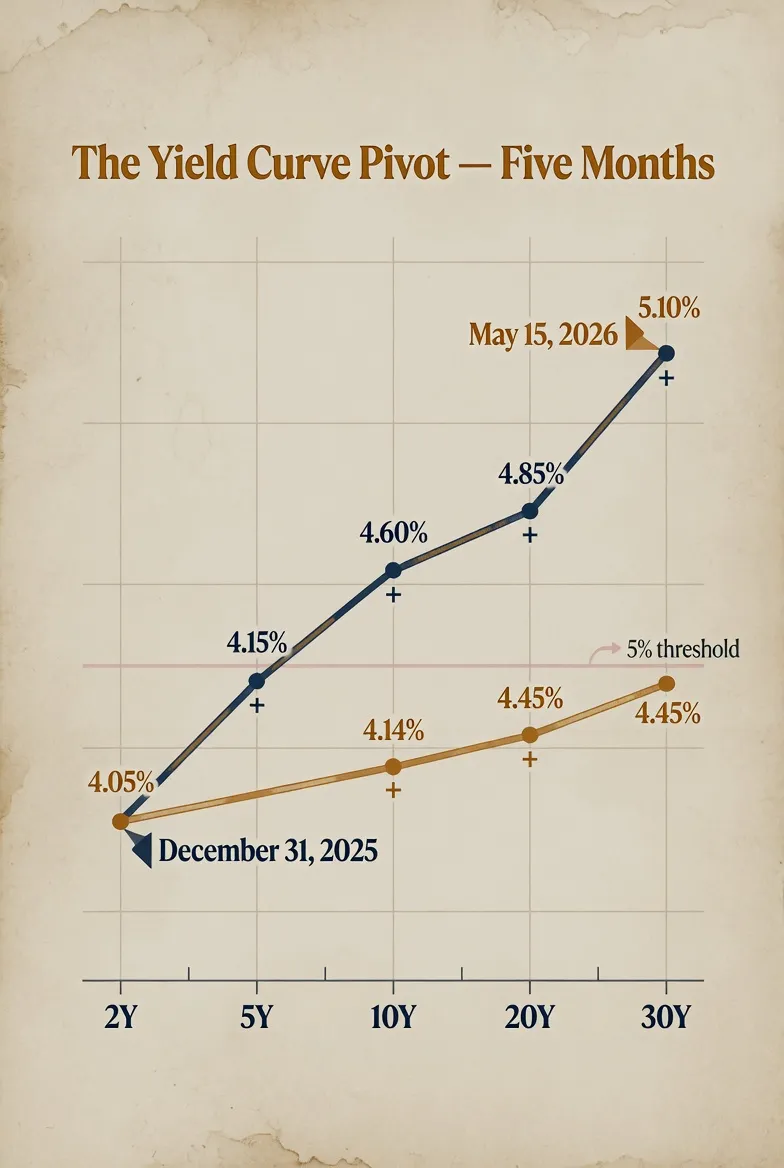
Yesterday I walked through what just happened in the Treasury market and why a retirement portfolio should care. Long-dated yields climbed about seventy basis points in eleven weeks. The 30-year yield pushed past 5%, and last Tuesday the Treasury issued new 30-year debt at a coupon above 5% for the first time since 2007. The bond market stopped behaving like the safe-haven asset it has been for forty years.
Today is the second half of the story. Two questions. Why is this happening, and what does it mean for the part of a retirement account that is not in bonds.
The why has three drivers. The what-it-means turns on a finance concept that has not been in most retail investors' working vocabulary for fifteen years: the cost of capital. When the "risk-free" rate resets materially higher, the cost of capital resets with it — for every public company. That repricing is real. Most of the major stock indexes have not yet fully absorbed it.
What Is Actually Driving the Regime Change
Three forces are pushing in the same direction at the same time, and the convergence is what makes this look structural rather than cyclical.
Iran and the Oil Floor
The first driver is the simplest. On February 28, U.S. and Israeli forces struck Iran. Within days, the Strait of Hormuz — the narrow shipping passage through which roughly 20% of the world's oil moves — was effectively closed. Oil prices doubled within weeks. Headline CPI worked its way back toward a "4-handle" — a reading above 4% — through the spring.
The bond market's first move was the one that should have surprised more people: yields rose. CNBC's day-one headline put it directly — "bonds defy safe-haven playbook." The market was not pricing a growth scare that the Fed could rescue with rate cuts. It was pricing an inflation shock that rate cuts cannot fix.
The harder part of the Iran story is what happens after a peace deal, if one comes. Lombard Odier's April assessment was direct: the infrastructure damage from the war — to wells, pipelines, refineries, and the production capacity that millions of barrels a day depends on — would take weeks to months at minimum to restore even under a full ceasefire. The oil price floor does not snap back to $70 the day the war ends. That means the inflation backdrop the Fed has to navigate is sticky in a way most investors did not price into bond markets in December.
The Fiscal Math
The second driver is the one that would have shown up eventually whether or not Iran ever happened. It is the math of U.S. government finances, and it does not depend on anyone's political preference. It depends on arithmetic.
The U.S. national debt is approaching $40 trillion. The annual federal deficit is running at roughly 8% of GDP and projected to stay near that level through 2027. Eight-percent-of-GDP deficits are war-time deficits, sustained outside a war. The funding has to come from somewhere, and "somewhere" means somebody has to buy the Treasury bonds the government issues to finance the gap.
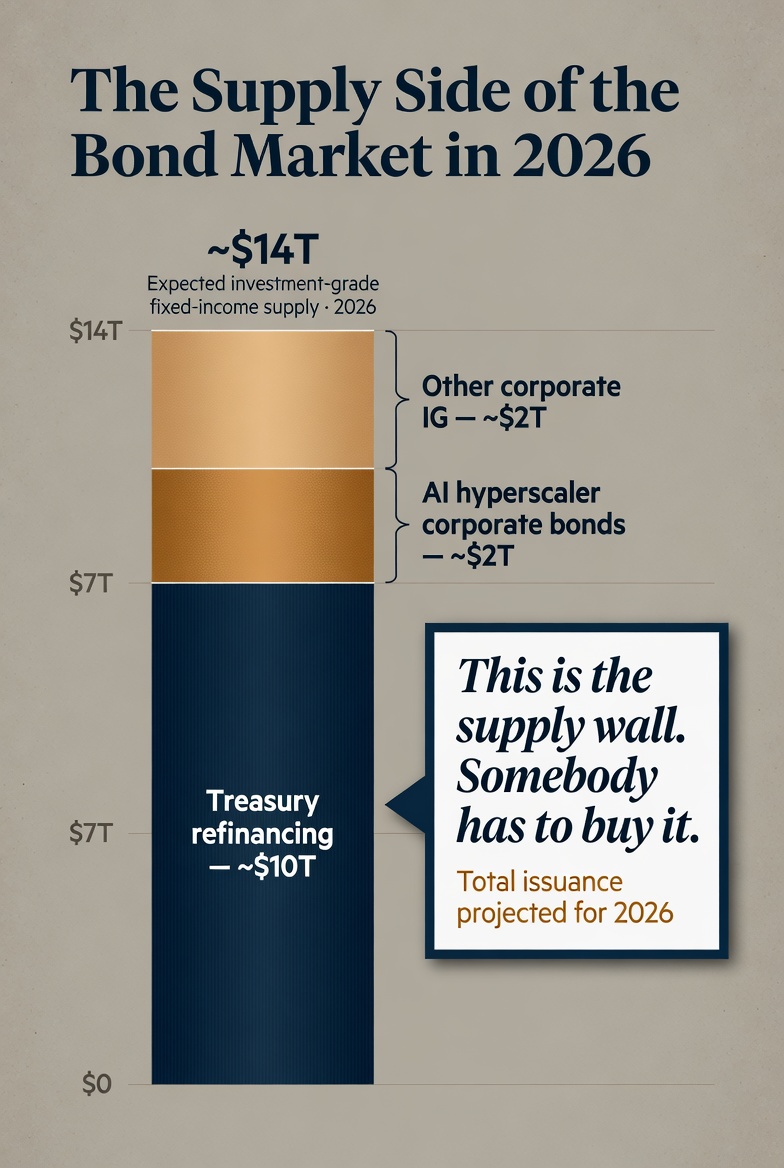
On top of that supply: an estimated $14 trillion in total investment-grade fixed-income issuance is expected in 2026, including roughly $2 trillion in corporate bond supply from AI hyperscalers alone — the cloud and chip giants financing data-center buildout. All of it is competing with Treasury issuance for the same pool of duration-buying capital.
The buyers are noticing. March 2026 was the weakest Treasury auction month in over three years. The May 13 sale of $25 billion in 30-year Treasuries cleared at a 5.046% yield — the first time since 2007 that the Treasury has issued long bonds at a coupon above 5%, even as the secondary market yield had briefly crossed that threshold in October 2023 and again in May 2025. Bloomberg described the auction as showing "middling demand." The Treasury itself announced it would need to borrow more than previously estimated this quarter, citing softer-than-expected cash flow. The fiscal math does not care who is in office. The supply has to find buyers, and the buyers are asking for a higher yield to absorb it.
The Warsh Pivot
The third driver became official the day Part 1 of this series ran. Jerome Powell's term as Fed Chair ended Friday, May 15. Kevin Warsh — a former Fed governor and investment banker — took the chair.
Warsh's policy posture is materially different from Powell's. He has consistently argued for a smaller Fed balance sheet, less forward guidance, and more reliance on incoming data rather than pre-committed paths. "Smaller balance sheet" means less Fed buying of longer-dated Treasury bonds, which means more of that supply has to be absorbed by private buyers at whatever yield private buyers will accept. "Less forward guidance" means fewer signals that rates are headed in any particular direction. The bond market has to find its own equilibrium without the Fed standing on the scale.
Politico reported that three of Warsh's incoming colleagues had signaled last month that rate increases could be "just as likely as rate decreases." As of Friday, CME futures briefly priced a 45–50% probability of a rate hike in December. The CME FedWatch tool has effectively priced out any rate cut at all until at least the end of 2027. Boston Fed President Susan Collins, in a public statement last month, said her tolerance for dismissing another supply shock had been diminished by five years of inflation above target, and that she could foresee a scenario where policy tightening might be necessary. Fed Governor Chris Waller had warned earlier that consecutive supply shocks would keep inflation elevated for an extended period.
The takeaway for bond yields is clean. The Fed under Warsh is not the Fed that bond markets priced for at the end of last year. The rescue is not waiting around the next corner. And the long end of the Treasury curve — the end most exposed to fiscal supply and inflation expectations — has the least reason of anywhere in the bond market to expect relief.
The Equity Pivot Most Investors Have Not Made
Every number in this article up to now has been a bond-market number. So it is reasonable to ask why an equity holder should read past this point.
Here is the reason. The Treasury yield is not just a bond-market number. It is the input that sits at the bottom of how every public company in America is valued.
The Discount Rate Problem
A quick vocabulary stop. The risk-free rate is the return an investor can get from lending to the U.S. government — typically measured by the 10-year Treasury yield. It is called "risk-free" because the U.S. Treasury is assumed never to default. The equity risk premium is the extra return investors demand for buying a stock instead of a Treasury bond, because stocks can lose value, companies can fail, and earnings can disappoint. Add the two together and you get the discount rate — the rate at which investors are willing to value a future dollar of company earnings today.
When the discount rate is low, future earnings translate into a lot of present-day value, and stocks can trade at high multiples — high prices per dollar of expected earnings. When the discount rate is high, future earnings are worth less today, and the multiples have to come down to reflect that math.
Now run the numbers. When the 10-year Treasury paid 1.5% — where it sat for much of 2021 — a stock that investors expected to deliver 7% a year over the long run offered a 5.5-percentage-point reward for taking risk. That was a healthy premium. Today the 10-year pays 4.60%. For that same stock to deliver the same 5.5-percentage-point reward, the expected return now has to move up to roughly 10%. There are only two ways that happens. Either the company's earnings grow faster than they were going to — which is hope, not arithmetic — or the price you pay for the stock today has to come down, so the same future earnings translate into a higher expected return for the next buyer. Over time, in practice, it is almost always the second mechanism that does the work.
That is the cost-of-capital reset. It is not a prediction about next month. It is a math problem the market is in the process of working through, and the working-through happens unevenly across companies depending on what kind of business they are.
Compression Into the Cash-Rich
The companies that get hit hardest by the cost-of-capital reset are the ones that need to borrow to grow. Smaller businesses dependent on bank credit. Middle-market companies with floating-rate debt. Real estate operators with mortgage financing. Highly indebted public companies. For all of these, the cost of the next dollar of capital just went up materially, and the math of their projects, their growth plans, and their financing has to be redone in real time.
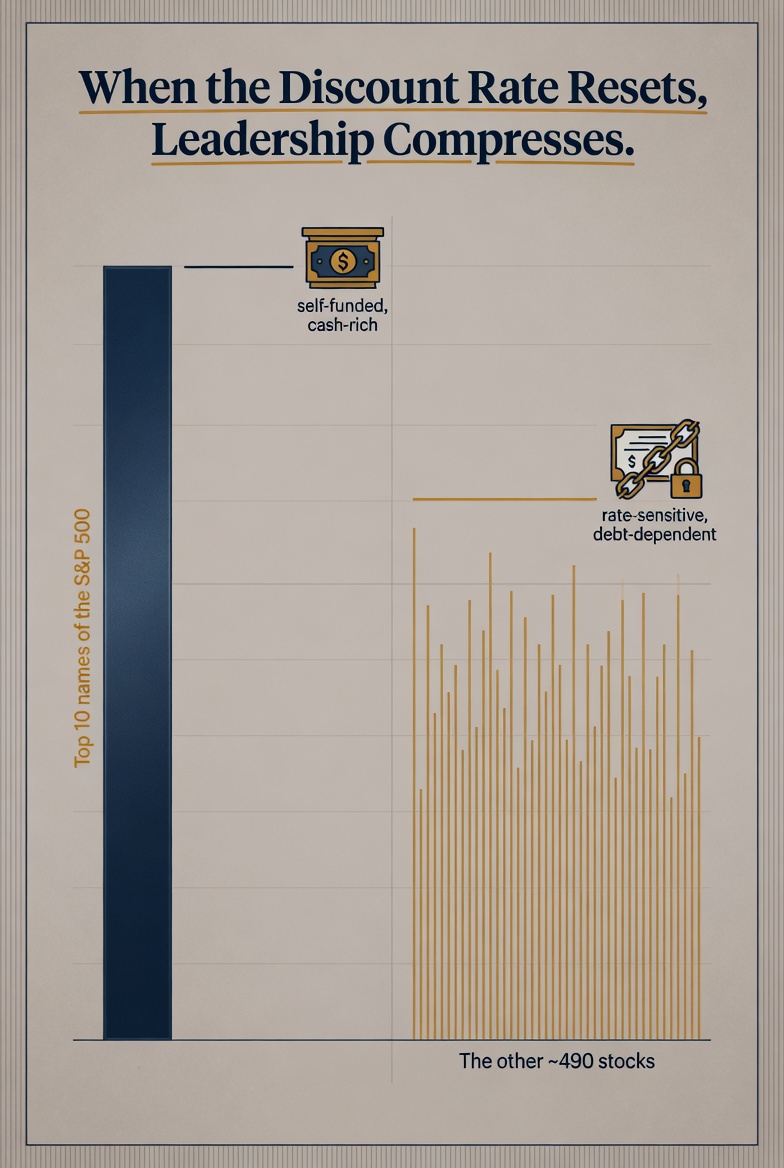
Then there is a smaller group of companies for which the same regime change looks almost like a non-event. The largest technology companies — Apple, Microsoft, Alphabet, Amazon, Meta, Nvidia, and Tesla, collectively known as the Mag-7 — sit on cash balances that run, between them, into the hundreds of billions of dollars. They generate enormous free cash flow every quarter. They self-fund their growth. They do not have to borrow at 5% to build a data center; they can write the check from operating cash. The cost-of-capital reset that is squeezing everyone else effectively does not touch them.
That asymmetry creates a market dynamic worth thinking about carefully. The natural response of capital to a high-rate regime is to compress into the companies that can ignore the rate regime. Money flows toward the firms whose growth is self-funded and whose competitive position deepens as financing costs squeeze their would-be rivals. The headline index keeps rising because a handful of trillion-dollar names are pulling it up. The 470 or 480 companies that are not in that small cash-rich club quietly do something different. That is the mechanism underneath the pattern I described last week in "All-Time Highs, Almost Alone." A handful of names carrying the index; equal-weight versions lagging by a factor of two; earnings revisions stacked into four tickers; half the index below its short-term trend at the all-time high. The symptom got described last week. The cost-of-capital reset is one of the underlying causes.
The Mag-7 concentration this article identifies is itself a risk vector. Valuations at the top of the index reflect the same flight-to-cash-richness dynamic the article describes; if that dynamic reverses — through earnings disappointment at any of the named companies, antitrust or regulatory action, a shift in the rate regime that re-democratizes the cost of capital, or simple mean-reversion in concentration — the same index that has been held aloft by these names becomes vulnerable to a re-pricing in the other direction. Identifying the concentration is not the same as recommending the names causing it. The point is to make sure the reader sees what is actually in the portfolio they hold.
What This Means for the Fragile Decade
A 62-year-old reading the financial news right now is looking at headline indexes near or at record highs. The screens, by themselves, look reassuring. The thing the headline number does not say is that those record highs are being held up by a handful of names that have decoupled from the rate environment that is repricing everything else in the market.
That is concentration risk that does not look like concentration risk on a brokerage statement. A retirement account that holds "the S&P 500" in 2026 is, at the margin, carrying a heavier bet on six or seven mega-cap companies than the same account held in 2019 — not because the account holder chose more concentration, but because the index itself has become more concentrated. When the cost-of-capital math is being absorbed unevenly across the market, the index is no longer the cross-section of corporate America it once was. It is closer to a cross-section of corporate America plus an unintended bet on whether the cash-rich handful keeps doing what it has been doing.
This is the part of the math that does not negotiate. Sequence-of-returns risk does not care whether the loss came from a war, an earnings miss, a multiple compression, or a rotation out of a few cash-rich names. It cares about the date on the calendar when the loss arrives.
Why Our Design Exists
Part 1 walked through the fixed-income side of AGG's investment design. Today is the equity side.
The Equity Module
For clients whose retirement money is held in AGG-managed equity exposure, the equity mode of AGG's Automated Trading System (ATS) — the proprietary engine that powers AGG's Automated Discretionary Management service — applies its rules-based discipline throughout every trading day, not only at the weekly screening cycle. The engine performs an intra-day readiness check on its defensive positions on a regular cadence. The point of the readiness check is to make sure those defensive positions are aligned with where the underlying conditions sit right now, not with where they sat at the last full screening. Conditions can shift meaningfully between screening cycles in a market like this one — the bond-market repricing this article describes is exactly the kind of upstream event that changes the picture between screenings.
The readiness check is not a portfolio rebalance. It is a calibration check. The reason for the distinction is that markets shifting in real time are exactly the markets where defensive positions need to be ready in advance of rotation — not constructed after rotation has already become necessary. If the ATS's criteria say to rotate exposure out of broader equity holdings into the defensive sleeve, the defensive positions need to already be in the right shape. The regular intra-day cadence is what keeps that readiness intact across every trading session of every market.
Continuous monitoring across both sides of the account narrows exposure to severe drawdowns. It does not eliminate it; no system does. We take every measure practicable to keep the math of recovery on the client's side, because the math of recovery is the unforgiving variable for someone in the fragile decade. A 50% loss requires a 100% gain to recover. A 30% loss requires roughly a 43% gain. A 15% loss requires about 18%. The asymmetry is the thing.
The Discipline, Not the Vehicle
A directness point before this section closes. AGG's equity implementation depends on account size and mandate. Smaller accounts that don't meet our standard fee-schedule floor are accommodated through ETF-only management within the same Automated Discretionary Management service. Larger accounts run the same service against an individual-equity universe — large- and mid-capitalization U.S. equities with documented sector exclusions, supplemented by selected ETFs including certain commodity ETFs in the candidate universe — sized within each account according to the client's Investment Policy Statement.
In the individual-equity universe, a stock earns a place in the portfolio by passing a composite, rules-based screen that combines multiple measures into a single qualification score. Once a position is opened, the system re-screens it intra-day to verify the position still meets the conditions that justified opening it. A position that no longer meets those conditions becomes an exit candidate; a position that still does, stays. The signals and the score are proprietary; the discipline they enforce is the point.
When the broader market repriced over the last several weeks, our equity positions — the ETF allocations and the individual-equity holdings alike — participated in the move along with the rest of the market. Neither implementation is structured to systematically own only the cash-rich winners while avoiding everything else. The differentiator is not the vehicle. It is the discipline applied to the vehicle — duration discipline on the bond side, readiness calibration on the defensive equity positions, composite-score screening on individual stock holdings, and the willingness to rotate exposures when the ATS's criteria say the picture has changed rather than letting a default allocation ride into the next drawdown.
Different Money, Different Jobs
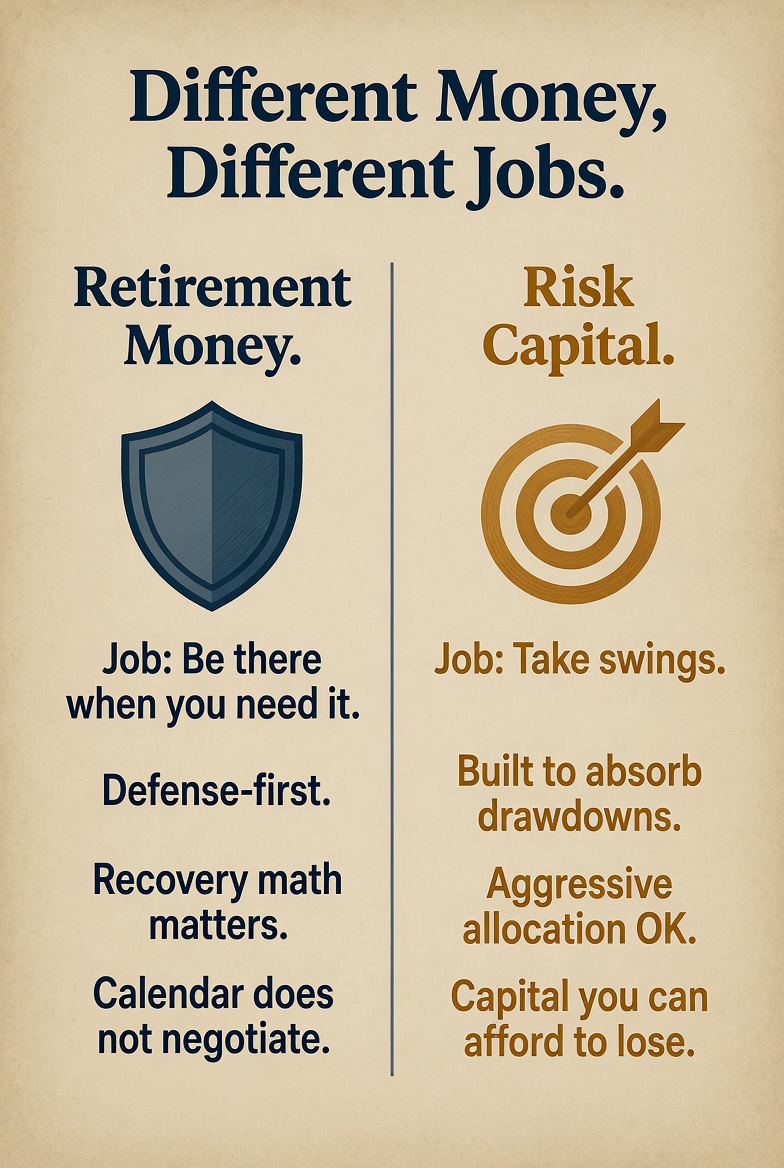
One frame I keep coming back to, because the longer I do this work the more I believe it is the single most important conversation a person in the fragile decade can have with whoever manages their money.
Different money has different jobs.
Retirement money has one job — to be there when you need it. The unforgiving math of sequence-of-returns risk, the brutal recovery arithmetic of deep drawdowns, the fact that the calendar on which a portfolio is asked to support income does not negotiate with the calendar on which the market chooses to reprice — all of it converges on a single principle. The money you are going to live on cannot be the money you are speculating with. Not because speculation is wrong. Because the jobs are different.
Risk capital has a different job. It can take swings. It can sit through a drawdown. It can be allocated aggressively to exactly the kind of regime change this two-part series has been describing. For clients who want AGG-managed exposure to higher-risk, higher-return strategies with capital they can afford to put at risk, we run GrowthVector — our systematic, signal-driven aggressive-growth strategy with trade tickets executed by AGG's Investment Adviser Representative through the firm's qualified custodian. For active traders who make their own investment decisions and want rules-based research to inform them, we publish PulseSignal Weekly and RegimeSignal Weekly on Substack — paid research subscriptions presenting weekly picks with directional commentary and price targets. These publications are research only; they do not establish an advisory relationship between AGG and any subscriber, and the picks they present are not personalized investment advice. Subscribers act on published picks at their own risk. The trading strategies discussed in the publications are typically more aggressive than the discretionary advisory-account approach AGG manages under Automated Discretionary Management, and may not be appropriate for retirement capital.
The cost-of-capital regime described in this article is exactly the kind of environment where the two jobs get mixed up. Headline indexes near records make speculation feel free. The cash-rich Mag-7 keeps doing what it has been doing, and the temptation is to lean into more of the same. Junk bonds keep paying tight spreads, and the temptation is to reach for yield. Every dollar that gets pulled out of the job it was meant for and reassigned to a job it was never built to do is a dollar that becomes a sequence-of-returns problem the next time the market reminds everyone what its own playbook actually says.
What no fiduciary should do is mix those jobs in the same account because the rally feels good and the upside feels free. The cost of being wrong about that decision shows up at exactly the wrong time, in exactly the wrong account, and the math doesn't negotiate.
The two parts of this series have walked through one regime change — the Treasury yield environment of 2026 — and what it implies for both sides of a retirement portfolio. The numbers will keep moving. The Fed will say more things. The war will resolve, or it won't. Through all of it, the principle a retirement account most needs is not a forecast. It is a design that listens to what is actually happening, separates the money that has to be there from the money that can take a swing, and stays on the client's side of the recovery math.
That is the case I would make for the way we built it.

Take Action
If anything in this two-part series raised questions about your own portfolio — whether your bond side is doing the job your plan assumes, whether your equity side is more concentrated than your statement suggests, whether the money funding your retirement is doing the job your retirement needs it to do — I'd welcome that conversation. Reply to this email, call the office, or schedule a review here. For direct contact: [email protected].
───This post originally appeared on The Lighthouse on Substack — weekly financial analysis written specifically for people within ten years of retirement. Subscribe free at The Lighthouse on Substack or upgrade for weekly Trades of the Week picks.───
Investing involves risk, including the possible loss of principal. This article is for informational purposes only and does not constitute personalized investment advice. Past performance is not indicative of future results. Fixed income investments are subject to interest rate, credit, inflation, and liquidity risks. Equity investments are subject to market risk and may decline in value, sometimes significantly, over short or extended periods.
Wallace R. Nichols and other AGG supervised persons may hold, may have held, or may from time to time hold long or short positions in any of the securities discussed in this publication, including any of the companies named under the 'Mag-7' designation. AGG and its supervised persons do not undertake to disclose specific positions or to notify readers of position changes.
The recovery-math illustrations in this article are arithmetic examples of the relationship between loss and recovery; they are not performance claims, hypothetical results, or projections of any particular portfolio.
PulseSignal Weekly and RegimeSignal Weekly are research publications, not advisory products; subscription to either does not establish an advisory relationship with AGG.
Wallace R Nichols, MBA, JD, CFP Chief Investment Officer Asset Guidance Group, LLC, a registered investment advisor