$100 Oil Is a Bond Market Problem
Three weak Treasury auctions, a record $9.5 trillion in foreign-held US debt, and a correlation between oil prices and bond yields that retirees can't afford to ignore.
Something important happened in the Treasury market over the last six weeks, and most people missed it.
On February 27 — the day the Iran war began — the 10-year Treasury yield sat at 4.0%. Six weeks later it was bumping against 4.4%. That's a 40-basis-point move in a number that's supposed to drift in basis points, not handles.
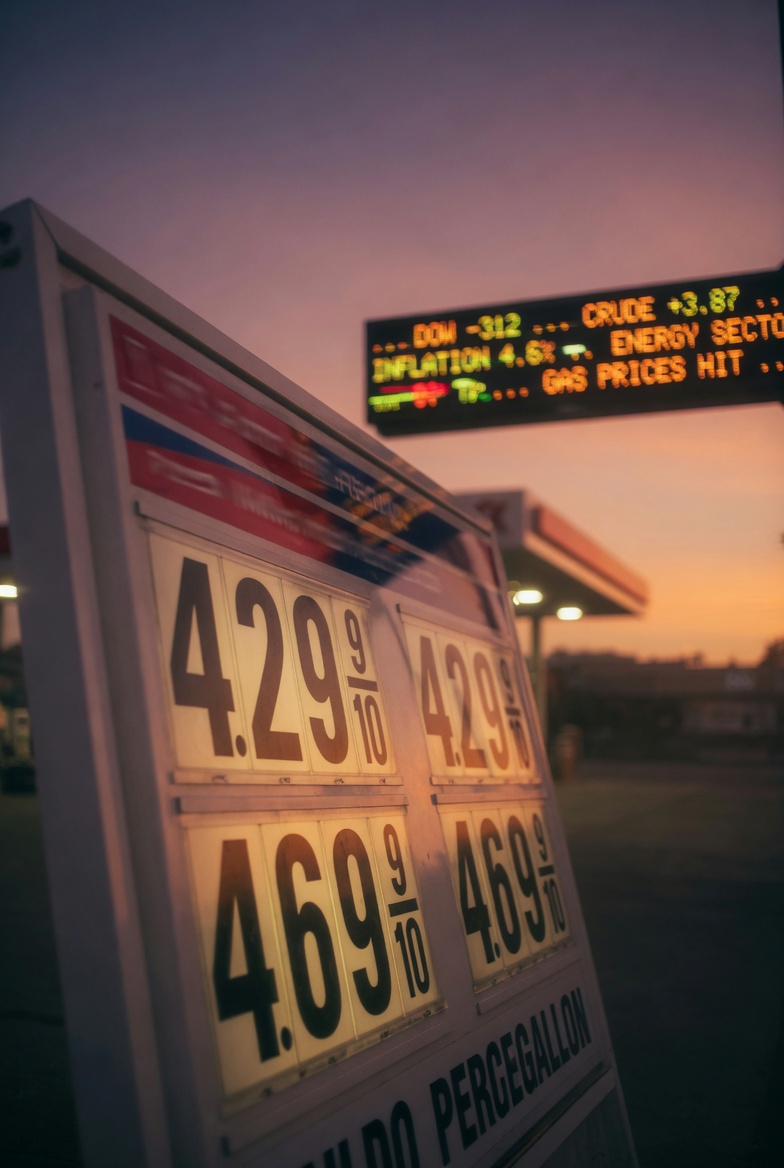
Over the same six weeks, Brent crude oil climbed from the $90s to above $100, and it's stayed there. As I write this, Brent is around $101 and the 10-year is holding near 4.3%.
Those two charts — the Treasury yield and the oil price — have been dancing together. When oil and bonds move in the same direction, it's almost never a coincidence. It's a message.
This is the first article in a three-part series about that message and what it means for anyone within ten years of retirement. The short version: the US Treasury market — the bedrock of your portfolio, whether you know it or not — is being pressured from three directions at once. The Iran war is one. The Bank of Japan is a second. Something called global liquidity is the third. Today we start with the one that's hitting right now: the auction room.

What Happened: Oil, Inflation, and Yields
Plain English first. When oil prices jump, the cost of almost everything rises — trucking, shipping, plastics, airline tickets, heating, groceries. Economists call that "headline inflation," and it shows up in the numbers within weeks.
When inflation rises, the Federal Reserve has a harder time cutting interest rates. And when the Fed looks less likely to cut, longer-term bond yields move up — because bonds compete with short-term cash, and if short-term cash stays expensive, longer bonds have to pay more to attract buyers.
That's the chain. Oil up → inflation up → Fed stuck → yields up. It doesn't trigger every time oil wiggles. But it triggers reliably when the oil shock looks sustained and structural — the way this one does, with the Strait of Hormuz still effectively closed and no clean exit from the conflict with Iran.
Why Your Bond Portfolio Noticed
If you own bonds — and most retirement portfolios do, because bonds are supposed to be the "safe" side — this mechanism matters. Bond prices move inversely to yields. When yields rise, the bonds you already own are worth less on paper.
A 40-basis-point move on a 10-year Treasury translates into roughly a 3–4% drop in the bond's price. Multiply that across a bond allocation and the "safe" side of the portfolio can lose real money in a hurry. That's not a failure of bonds. It's how the arithmetic works. But it's a reason to pay attention.
The Auction Room
Here's the part most people have never thought about. The US government has to borrow enormous sums — roughly $2 trillion a year in new net borrowing, on top of trillions more in maturing debt that rolls over. It does that through regularly scheduled Treasury auctions, where investors bid on how much interest the government must pay to get the debt sold.
Three numbers tell you whether an auction went well or poorly.
The bid-to-cover ratio measures how much demand showed up for every dollar of debt offered. Higher is better. The recent average for coupon auctions has been around 2.4 to 2.6.
The primary dealer share matters because primary dealers are 24 big banks required to bid on every auction. They're the buyer of last resort. When they end up holding an unusually large share, it means everybody else — pensions, foreign central banks, insurance companies, mutual funds — wasn't as hungry as expected.
The tail is the gap between the yield traders expected before the auction and the yield that actually cleared. A positive tail means demand was weaker than anticipated; the government had to pay more than expected to place the debt.
What Happened the Last Week of March
All three numbers came in weak on three consecutive auctions the last week of March 2026.
The 2-year auction was the worst. Primary dealers absorbed about 23% of the deal — more than double their normal share of roughly 11%. That means the real end-buyers stepped back. The bid-to-cover ratio came in at 2.44, below the recent average of 2.62. The auction tailed by 1.8 basis points.
The 5-year and 7-year auctions that followed were only modestly better. All three cleared at yields well above where markets had been trading just hours before. The Committee for a Responsible Federal Budget, which tracks this kind of thing closely, flagged the week as a warning sign and tied it directly to rising uncertainty from the Iran conflict.
Yields on the 2-, 5-, and 7-year Treasuries have risen more than 40 basis points since February 27. The mechanism isn't theoretical. It's running in real time.

Who's Not Showing Up
A fair question is: if the auction room got softer, who stepped back?
The simple narrative — "foreigners are dumping US debt" — is mostly wrong. The truth is more interesting.
As of February 2026, foreign investors held a record $9.49 trillion in US Treasuries, up almost $600 billion over the prior 12 months. That's not a buyer's strike.
But the composition of that demand is changing in ways that matter.
The Composition Shift
China and Hong Kong have been steadily reducing their holdings for a decade. Combined, they now hold around $962 billion — down roughly a third from their peak ten years ago, and down $96 billion in the last 12 months alone. That's a structural, strategic decision, and it isn't reversing.
Japan — the largest single foreign holder at $1.24 trillion — has been adding modestly. We'll come back to Japan tomorrow. It's the centerpiece of Part 2.
The Euro Area has been buying hand over fist, adding $164 billion over the last 12 months to a record $2.0 trillion. The United Kingdom, Canada, and financial-center countries have also been net buyers.
Here's the wrinkle worth understanding. A huge chunk of what's counted as "foreign" demand for Treasuries is really US hedge funds operating out of the Cayman Islands, running a leveraged strategy called the basis trade. The Federal Reserve's own research suggests these funds actually hold close to $2 trillion in Treasuries — not the $443 billion the official numbers show. That's highly leveraged, fragile demand. It worked beautifully until March 2020, when it seized up and forced the Fed to intervene directly in the Treasury market.
The Picture That Emerges
Traditional "sticky" buyers — foreign central banks and sovereign institutions — are less present than they used to be. Private foreign investors and leveraged hedge fund basis trades have been filling the gap. That's a more fragile balance, and it explains why even an event as significant as the Iran war can make auctions wobble.
Former Treasury Secretary Henry Paulson said the quiet part out loud earlier this month. He publicly warned that the US needs an emergency "break the glass" plan in case Treasury demand ever collapses. Officials at Paulson's pay grade don't say things like that unless the risk has moved from theoretical to worth preparing for.
What Does This Mean for Me?
If you're approaching retirement, here's what to take from this.
Bonds Are Not the Safe-Harbor They Used to Be
The traditional retirement playbook said: as you get closer to retirement, shift from stocks to bonds. Bonds are stable. They generate income. They protect you from stock market drawdowns.
That playbook was written for a world where bond yields were steady or falling. When yields rise — as they have repeatedly over the last four years — bond prices fall. Stocks and bonds can lose money at the same time, which is exactly what happened in 2022 and what has been happening in the broken-correlations environment I've written about throughout March.
Bonds still belong in most retirement portfolios. But the assumption that they are automatically the "safe" part needs serious updating.
The Oil Spike Doesn't Just Hit Your Gas Bill
This is the point worth sitting with. A sustained oil spike at $100 doesn't just make the trip to Kroger more painful. It keeps the Fed from cutting rates, which keeps long yields elevated, which can damage the bond side of your portfolio at the exact moment stocks are under pressure from the same macro stress. The connections matter.
The Bond Market Is Where Retirement Math Lives
The single biggest variable in most retirement plans is the assumed rate of return. When Treasury yields spike and hold, the entire discount rate for every other asset — stocks, real estate, income annuities, private investments — resets. The fragile decade is especially sensitive to these resets. A sustained interest-rate shift during the five years before and after retirement can mean the difference between a comfortable plan and a stressful one.

What Are We Doing About It?
Regular Lighthouse readers know the answer already. It bears repeating in this specific context.
Our Automated Trading System monitors risk signals across the bond market continuously — every 30 minutes throughout every trading day. Credit spreads, yield curves, auction health, volatility, cross-asset correlations, and more. When stress signals build, positioning adjusts. When they ease, positioning adjusts again.
The system doesn't try to predict whether Iran de-escalates next week or whether the next auction stabilizes. It responds to what the market is actually doing.
Why Rules Beat Instincts Here
A human watching these auction results could talk themselves into any number of conclusions — "this is the top, yields are about to fall," or "this is the start of a crisis, sell everything." Both have been wrong at various moments in history. Rules-based systems don't talk themselves into anything. They respond to the data, not to the narrative.
That's what I want in an environment where the narrative changes by the week.
In broad directional terms — and this is as specific as I'll get — we favor discipline around duration, the technical term for how sensitive a bond is to interest-rate moves. We don't lock clients into long-dated positions when the yield curve is unstable and auction demand is thinning. That's not a prediction. It's risk management.
Tomorrow: The Bank of Japan
The pressure on the US Treasury market isn't just coming from oil and shifting foreign composition. There's a third force, largely invisible to most US investors, that's about to arrive from the other side of the world.
The Bank of Japan held its main policy rate near zero for almost all of the last 30 years. As recently as 2020, Japanese 10-year government bonds paid a negative yield. A Japanese institution could borrow yen essentially for free, buy a US Treasury paying 4%, and pocket the difference. Trillions of dollars did exactly that, for decades. The trade has a name. It's called the yen carry trade, and it's one of the most powerful liquidity forces in global markets.
Japan is in the process of ending it.
Next in The Lighthouse — tomorrow: what a continued normalization of Bank of Japan policy — including the possibility of a 1% policy rate within the next year — would mean for US bonds, the carry trade, and your retirement portfolio. It's a story almost nobody is telling your audience, and it matters more than most of what is being covered.
Take Action
If you're reading this in your email inbox, the ❤️ heart button, the comment thread, and the share options are hiding from you on the Substack site. Click through — it takes two seconds, and every like helps The Lighthouse reach one more person who needs this analysis. If someone forwarded this to you, you can subscribe free at The Lighthouse. And if this piece made you think, please share it with anyone else in the fragile decade who is watching the bond market and wondering what's going on.
If you'd like to see how a disciplined, rules-based approach to the bond market could fit into your own plan, the Automated Trading System that does this work every day has its own page: assetguidancegroup.com/ats-mgmt-landing-page-347034.
If this article raised questions about your own situation, let's have that conversation. Reply to this email, write me directly at [email protected], call the office, or schedule a review here. No pitch, no pressure. Just an honest look at where you stand.
─── This post originally appeared on The Lighthouse on Substack — weekly financial analysis written specifically for people within ten years of retirement. Subscribe free at [The Lighthouse on Substack], or upgrade for weekly Trades of the Week picks. ───
Investing involves risk, including the possible loss of principal. This article is for informational purposes only and does not constitute personalized investment advice. Past performance is not indicative of future results.
Wallace R Nichols, MBA, JD, CFP Chief Investment Officer Asset Guidance Group, LLC, a registered investment advisor