Your Retirement Vision Begins with Illumination from Asset Guidance Group, LLC
Guiding Your Retirement with Experience, Integrity & Trust—Illuminating, Charting, Navigating
As Fiduciary Advisors, Your Success is Our First Priority.
Wallace R. Nichols, M.B.A., J.D., CFP® Professional

Certified Financial Planner Board of Standards, Inc. (CFP Board) owns the CFP® certification mark, the CERTIFIED FINANCIAL PLANNER™ certification mark, and the CFP® certification mark (with plaque design) logo in the United States, which it authorizes use of by individuals who successfully complete CFP Board’s initial and ongoing certification requirements.
Additional Professional Credentials and Skillsets That Distinguish Us From the Dinosaurs Out There:
Earners of this Microcredential have demonstrated a foundational understanding of digital assets. This includes the history of digital assets, blockchain technology, digital asset use cases, and investing considerations such as valuation, risk and return, and asset allocation. Individuals will have also mastered the tenets of client communication and key operational considerations, including custody, access, regulation, taxes, and compliance.
Welcome to Asset Guidance Group, LLC!
Your Trusted Partner in Holistic Retirement Planning and Fiduciary Financial Advisory Services
At Asset Guidance Group, LLC*, we understand that planning for retirement can be overwhelming. That's why we're here to guide you every step of the way with personalized, comprehensive retirement strategies designed to secure your financial future. Whether you're an entrepreneur, a family, or an individual, our expert fiduciary advisors are committed to providing you with the best retirement investments, tailored financial advice, and a clear path to achieving your retirement goals.
*a registered investment advisor.
Why Choose Us?
Expert Fiduciary Advisors: Our team of certified financial planners and fiduciary advisors prioritize your best interests, offering unbiased advice and strategic planning to maximize your retirement savings.
Customized Retirement Solutions: We don't believe in one-size-fits-all. Our holistic approach ensures that your retirement plan is tailored to your unique financial situation and goals.
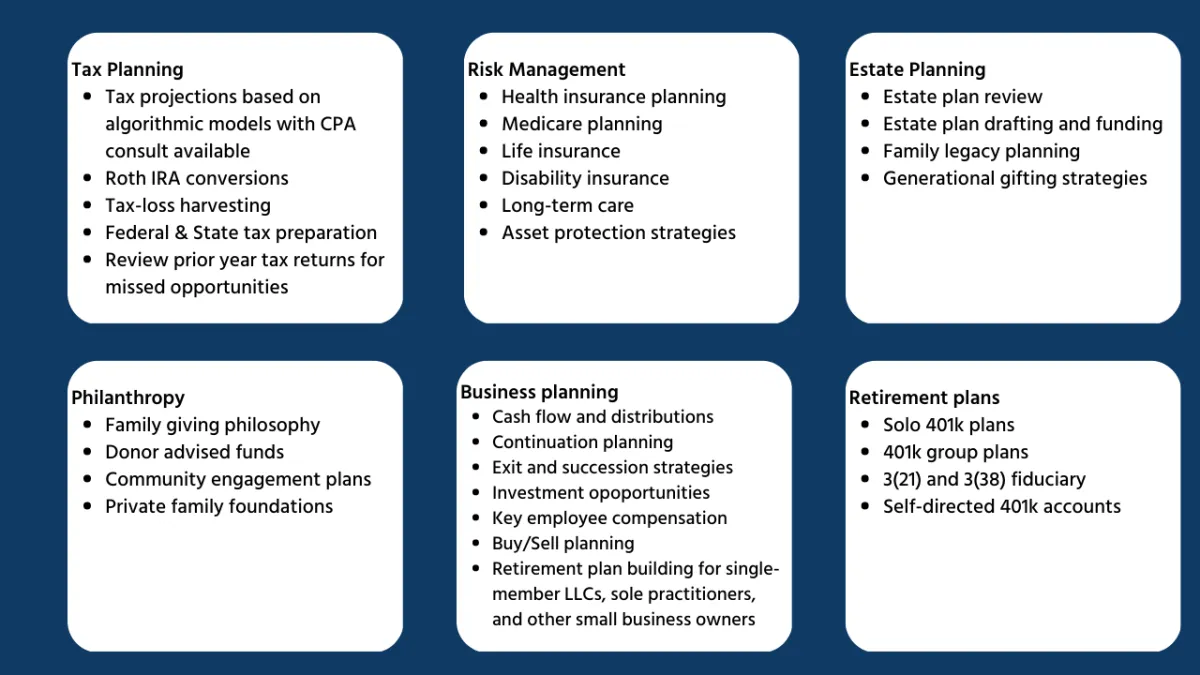
Comprehensive Financial Planning: From tax optimization and estate planning to investment management and risk mitigation, we cover all aspects of your financial life to ensure a secure and prosperous retirement.
Proven Track Record: With years of experience and a dedication to excellence, we have helped countless clients achieve financial peace of mind and retire with confidence.
See Success in Action!
**Watch Our 1-Minute Animated Video to Learn More**
Discover how we helped Paige, a successful female business owner, achieve her retirement goals with a tax-efficient plan that protected her cash flow and ensured her financial security.
Watch the Video Now to see how our personalized approach can provide you with the peace of mind and financial stability you deserve. Don’t miss this quick and insightful overview of our expertise in action!
Get Started Today!
Secure your financial future with the guidance of our trusted advisors.
Schedule a Free Strategy Session using the form below,
or phone us at
404-348-4120
to discover how we can help you create a personalized retirement plan that works for you.
Transform your financial future with Asset Guidance Group, LLC – where your dreams of a secure and comfortable retirement become reality.
Meet the Team of Professionals
EXPERIENCE.INTEGRITY.TRUST
True Fiduciary Financial Advisors who put your best interests first--every time!

Jarod W Nichols
VP Client Relations, Investment Advisor Representative
Click here to learn more about Jarod's biography
Wallace R Nichols, MBA, JD, CFP
Founder, Managing Member & Chief Investment Officer
Click here to learn more about Wally's biography
READY TO GIVE US A TRY?
Get Started for Free Today!
Secure your financial future with the guidance of our trusted advisors.
Schedule a Free Strategy Session
using the form below,
or phone us at
404-348-4120
to discover how we can help you create a personalized retirement plan that works for you.
Transform your financial future with Asset Guidance Group, LLC – where your dreams of a secure and comfortable retirement become reality
We offer High-Net-Worth level services, no matter your wealth level
Because everyone deserves access to superior, comprehensive investment strategies, financial services, and advice. That’s the type of services true fiduciary financial advisors deliver!

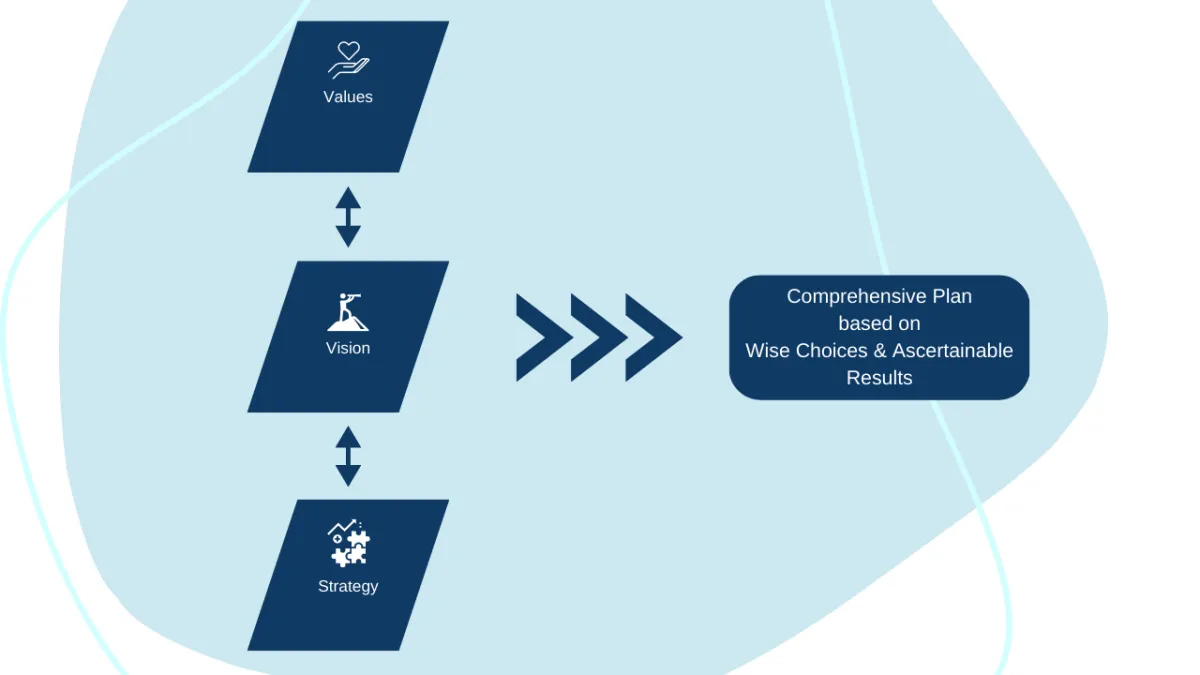
Our Process
We begin with the most important.
Every individual and family has their unique circumstances. Likewise, every individual and family has their unique values, goals, and vision for their future. So, that’s where we start: your values and vision. Then, we connect your financial assets with what is most important to you. It’s a sacred obligation because it involves sacred money: your life’s work.
Wealth management involves more than just financial planning.
Wealth management requires a team of multidisciplinary advisors who are committed to the only goal that matters–helping you achieve your financial plan and live the life you want. Our process of wealth management delivers, because that’s what true fiduciary financial advisors do.
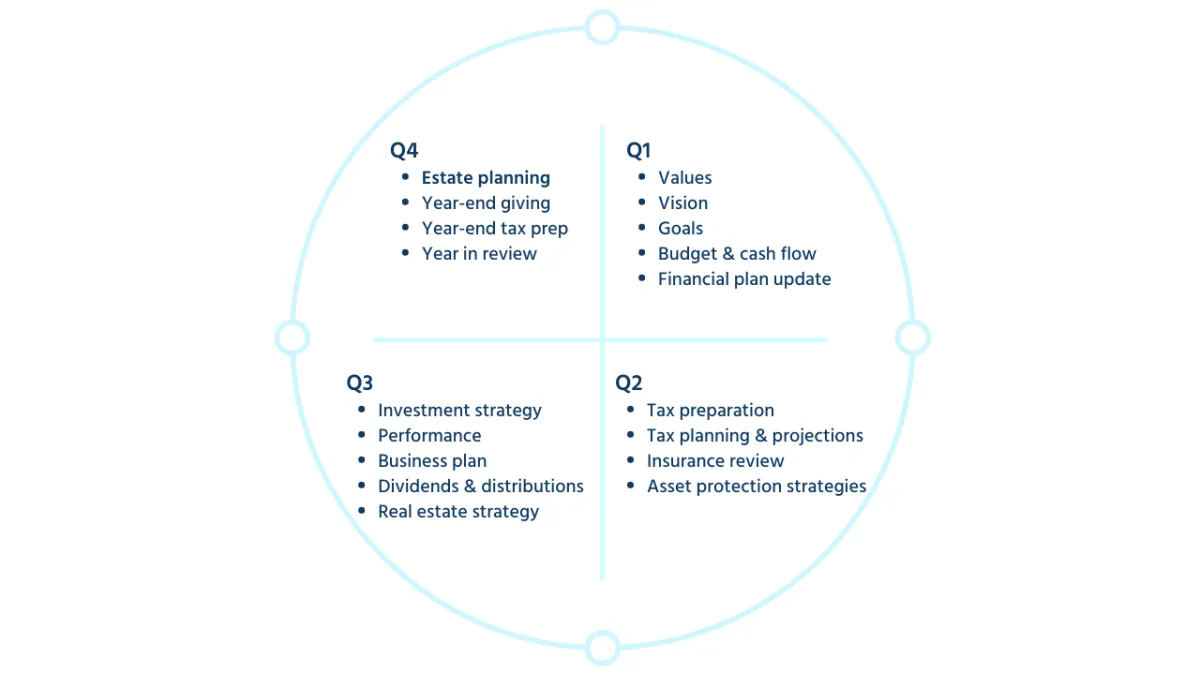
Your financial plan must stay evergreen and evolve to adapt with your life as things change.
Asset Guidance Group allows you to focus on living your life while knowing that your advior is taking care of the planning. our quarterly focus map guides the key planning conversations that your advisors will use to help you navigate the waters you’re sailing as the year progresses.
Objective, client-centric advice
Conventional firms get paid only when you move your investments to their firm. That action results in a conflict of interest. To avoid that result, we simply charge separate fees–one for financial planning and one for investment management. In that fashion, we deliver truly objective advice and remove any conflicts by being fully transparent with disclosures.
Ready to See the Big Picture?
Watch a Brief Summary of the Process
After exploring our comprehensive planning process, take a moment to watch our short animation. This concise video perfectly summarizes everything you've just read, giving you a clear visual understanding of how we can help you achieve your financial goals.
Watch the Summary Animation and see how our strategic approach to retirement planning can work for you!
Learn More About How We Help People Navigate Complex Retirement Issues

READY TO GIVE US A TRY?
Get Started for Free Today!
Join our boutique of family offices--You'll love doing business with Asset Guidance Group!
We'll find a way to win for you--if you'll let us!

Want to know your current financial condition?

Invest in Your Future Now!
Chronic indecision leads to chronically bad decision-making. Failure to plan results in failure. Get on the road to success. We'll build you a roadmap, so you know when and where to execute proper techniques. Click the button below to get started now!

Have a General Question?
Ask our AI Bot

READY TO GIVE US A TRY?
Discover the Benefits of Professional Planning & Asset Management
TESTIMONIALS
What others are saying

"Managed our money as though it were his own"
When we connected with Asset Guidance Group and Wally Nichols about ten years ago, we anticipated a rather modest retirement based a pension and stagnant savings. During our tenure with Wally, we’ve been educated about options that have significantly increased our investments. We’ve been engaged in decisions, reviewed investment models, discussed actual and anticipated market fluctuations – and Wally Nichols has managed our money as though it were his own. I would recommend Wally Nichols and Asset Guidance Group to any and all who are interested in planning for their future.
--Kelly Buck


"Clearly Trustworthy"
After meeting Wally in a retirement seminar at a local college, I was immediately impressed by his knowledge and passion over retirement finances and planning. It was apparent that he was trustworthy and that there would be no question that his clients' needs would be at the forefront of his guidance. My fiancé and I immediately setup a complimentary consultation and we have been nothing but highly satisfied by his outstanding customer service and support since that day. Wally’s knowledge of the financial industry is expansive, yet he patiently and respectfully explains these higher concepts on a level we could understand. He takes your unique situation and prior experiences into consideration when making recommendations and I was impressed that he helps clients from all walks of life and financial states. It’s been exciting to see my retirement financial wellbeing increase under his guidance. And having peace of mind that my hard-earned money is secure, especially during these tumultuous times, is invaluable. I am typically a skeptic, but Wally has managed to earn my respect as a trusted financial advisor.
- Jennifer Allen

"Glad to have them in my corner"
The team over at AssetGuidanceGroup is strong. Some of strengths are the charts that are easy to follow and their weekly updates that keep me informed. Glad to have them in my corner.
- George F Taylor III
*All client testimonials are from authentic clients. Such clients voluntarily gave their testimonials. Such clients were not compensated for their testimonials.
These materials have been independently produced by Asset Guidance Group, LLC, a registered investment advisor (“AGG”). AGG is independent of, and has no affiliation with, Charles Schwab & Co., Inc. or any of its affiliates (“Schwab”). Schwab is a registered broker-dealer and member SIPC. Schwab has not created, supplied, licensed, endorsed, or otherwise sanctioned these materials nor has Schwab independently verified any of the information in them. AGG provides you with investment advice, while Schwab maintains custody of your assets in a brokerage account and will affect transactions for your account on our instruction.
Explore Your Personalized Retirement Options—See More Now!
Book now and let's learn about you and your goals. You are losing money every day until you take action now!
By clicking the button below, you can schedule a Zoom meeting. This will allow you to select a convenient time to discuss your personal situation with us. Our bot will send you a notice you can put on your calendar so you won't miss it. Better yet: neither of us have to deal with traffic!
Get In Touch
Facebook
Instagram
X
LinkedIn
Youtube